Tohono O'odham vs West Indian In Labor Force | Age 16-19
COMPARE
Tohono O'odham
West Indian
In Labor Force | Age 16-19
In Labor Force | Age 16-19 Comparison
Tohono O'odham
West Indians
31.3%
IN LABOR FORCE | AGE 16-19
0.0/ 100
METRIC RATING
322nd/ 347
METRIC RANK
31.3%
IN LABOR FORCE | AGE 16-19
0.0/ 100
METRIC RATING
321st/ 347
METRIC RANK
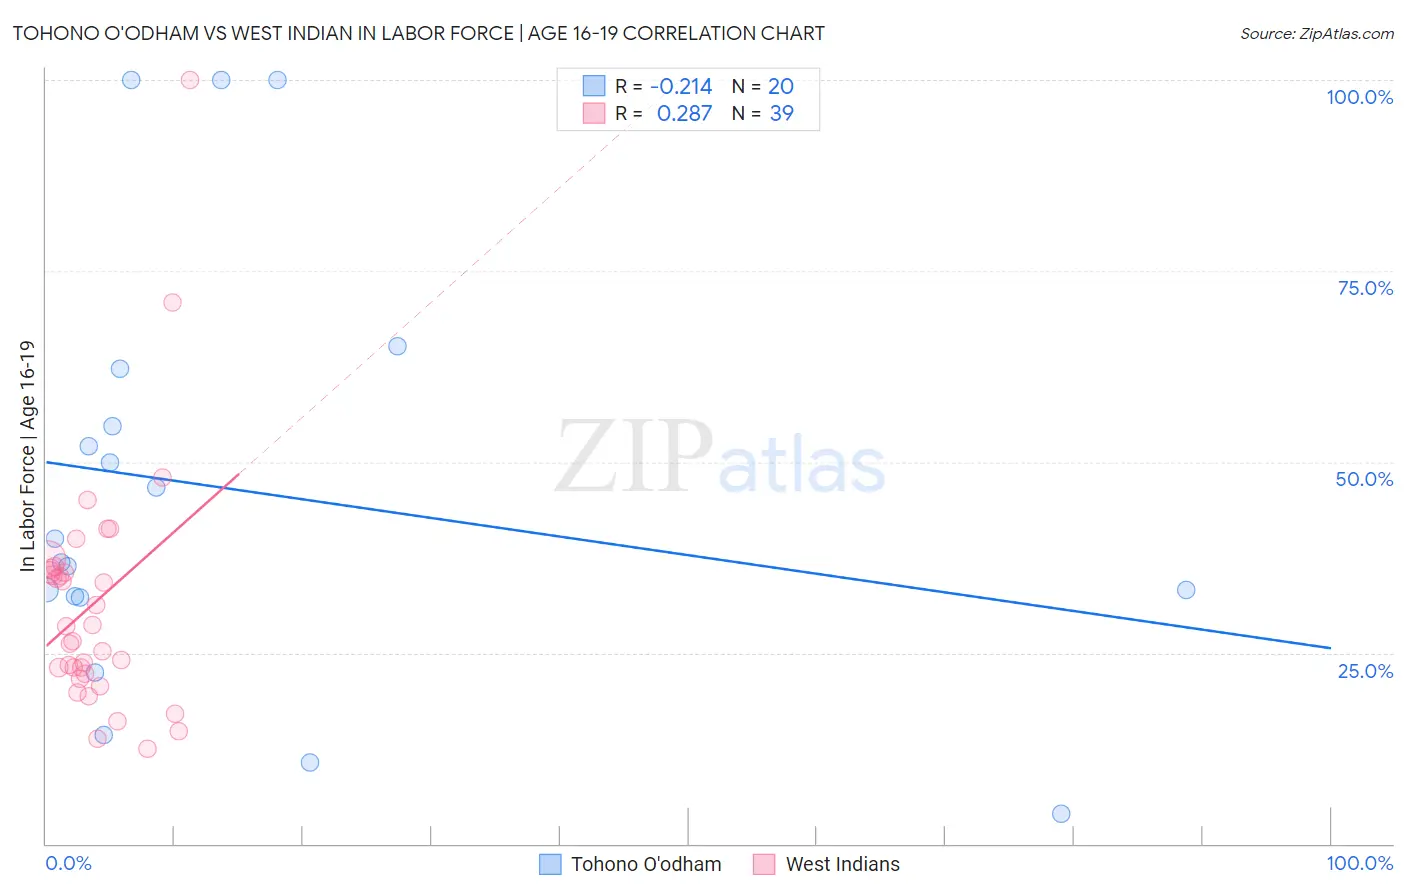
Tohono O'odham vs West Indian In Labor Force | Age 16-19 Correlation Chart
The statistical analysis conducted on geographies consisting of 58,700,142 people shows a weak negative correlation between the proportion of Tohono O'odham and labor force participation rate among population between the ages 16 and 19 in the United States with a correlation coefficient (R) of -0.214 and weighted average of 31.3%. Similarly, the statistical analysis conducted on geographies consisting of 253,845,757 people shows a weak positive correlation between the proportion of West Indians and labor force participation rate among population between the ages 16 and 19 in the United States with a correlation coefficient (R) of 0.287 and weighted average of 31.3%, a difference of 0.12%.
In Labor Force | Age 16-19 Correlation Summary
| Measurement | Tohono O'odham | West Indian |
| Minimum | 4.0% | 12.5% |
| Maximum | 100.0% | 100.0% |
| Range | 96.0% | 87.5% |
| Mean | 46.3% | 31.4% |
| Median | 38.3% | 28.5% |
| Interquartile 25% (IQ1) | 32.4% | 22.3% |
| Interquartile 75% (IQ3) | 58.5% | 35.9% |
| Interquartile Range (IQR) | 26.1% | 13.6% |
| Standard Deviation (Sample) | 28.1% | 15.9% |
| Standard Deviation (Population) | 27.4% | 15.7% |
Demographics Similar to Tohono O'odham and West Indians by In Labor Force | Age 16-19
In terms of in labor force | age 16-19, the demographic groups most similar to Tohono O'odham are Immigrants from Caribbean (31.2%, a difference of 0.13%), Dominican (31.2%, a difference of 0.31%), Ecuadorian (31.4%, a difference of 0.35%), Soviet Union (31.4%, a difference of 0.41%), and Immigrants from China (31.1%, a difference of 0.46%). Similarly, the demographic groups most similar to West Indians are Ecuadorian (31.4%, a difference of 0.23%), Immigrants from Caribbean (31.2%, a difference of 0.25%), Soviet Union (31.4%, a difference of 0.30%), Dominican (31.2%, a difference of 0.43%), and Immigrants from China (31.1%, a difference of 0.58%).
| Demographics | Rating | Rank | In Labor Force | Age 16-19 |
| Indians (Asian) | 0.0 /100 | #311 | Tragic 31.9% |
| Immigrants | Belize | 0.0 /100 | #312 | Tragic 31.8% |
| Hopi | 0.0 /100 | #313 | Tragic 31.8% |
| Cubans | 0.0 /100 | #314 | Tragic 31.8% |
| Immigrants | West Indies | 0.0 /100 | #315 | Tragic 31.7% |
| Filipinos | 0.0 /100 | #316 | Tragic 31.7% |
| Immigrants | Nicaragua | 0.0 /100 | #317 | Tragic 31.6% |
| Immigrants | Yemen | 0.0 /100 | #318 | Tragic 31.5% |
| Soviet Union | 0.0 /100 | #319 | Tragic 31.4% |
| Ecuadorians | 0.0 /100 | #320 | Tragic 31.4% |
| West Indians | 0.0 /100 | #321 | Tragic 31.3% |
| Tohono O'odham | 0.0 /100 | #322 | Tragic 31.3% |
| Immigrants | Caribbean | 0.0 /100 | #323 | Tragic 31.2% |
| Dominicans | 0.0 /100 | #324 | Tragic 31.2% |
| Immigrants | China | 0.0 /100 | #325 | Tragic 31.1% |
| Immigrants | Dominican Republic | 0.0 /100 | #326 | Tragic 31.1% |
| Immigrants | Taiwan | 0.0 /100 | #327 | Tragic 31.0% |
| Immigrants | Ecuador | 0.0 /100 | #328 | Tragic 31.0% |
| Barbadians | 0.0 /100 | #329 | Tragic 31.0% |
| Lumbee | 0.0 /100 | #330 | Tragic 31.0% |
| Trinidadians and Tobagonians | 0.0 /100 | #331 | Tragic 30.9% |