Carpatho Rusyn vs Irish In Labor Force | Age 16-19
COMPARE
Carpatho Rusyn
Irish
In Labor Force | Age 16-19
In Labor Force | Age 16-19 Comparison
Carpatho Rusyns
Irish
40.8%
IN LABOR FORCE | AGE 16-19
100.0/ 100
METRIC RATING
47th/ 347
METRIC RANK
42.0%
IN LABOR FORCE | AGE 16-19
100.0/ 100
METRIC RATING
31st/ 347
METRIC RANK
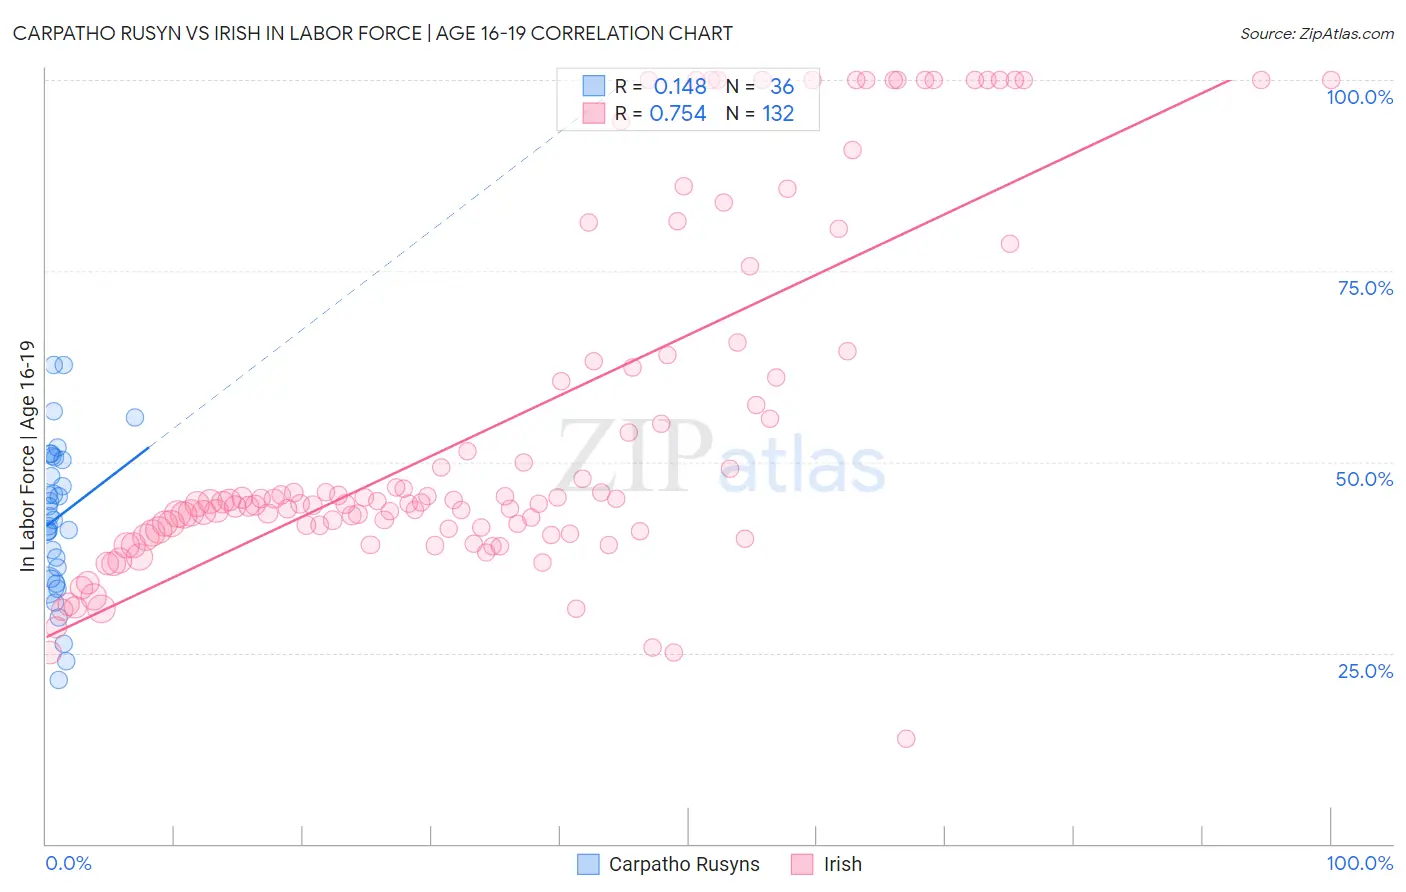
Carpatho Rusyn vs Irish In Labor Force | Age 16-19 Correlation Chart
The statistical analysis conducted on geographies consisting of 58,860,785 people shows a poor positive correlation between the proportion of Carpatho Rusyns and labor force participation rate among population between the ages 16 and 19 in the United States with a correlation coefficient (R) of 0.148 and weighted average of 40.8%. Similarly, the statistical analysis conducted on geographies consisting of 574,711,118 people shows a strong positive correlation between the proportion of Irish and labor force participation rate among population between the ages 16 and 19 in the United States with a correlation coefficient (R) of 0.754 and weighted average of 42.0%, a difference of 2.9%.
In Labor Force | Age 16-19 Correlation Summary
| Measurement | Carpatho Rusyn | Irish |
| Minimum | 21.5% | 13.8% |
| Maximum | 62.8% | 100.0% |
| Range | 41.3% | 86.2% |
| Mean | 42.7% | 54.4% |
| Median | 42.6% | 44.6% |
| Interquartile 25% (IQ1) | 35.4% | 41.0% |
| Interquartile 75% (IQ3) | 50.5% | 62.8% |
| Interquartile Range (IQR) | 15.1% | 21.8% |
| Standard Deviation (Sample) | 9.9% | 22.9% |
| Standard Deviation (Population) | 9.8% | 22.8% |
Demographics Similar to Carpatho Rusyns and Irish by In Labor Force | Age 16-19
In terms of in labor force | age 16-19, the demographic groups most similar to Carpatho Rusyns are Icelander (40.8%, a difference of 0.050%), Cree (40.8%, a difference of 0.070%), Immigrants from Sudan (41.0%, a difference of 0.47%), Croatian (41.1%, a difference of 0.79%), and European (41.1%, a difference of 0.82%). Similarly, the demographic groups most similar to Irish are Scottish (42.0%, a difference of 0.070%), Czechoslovakian (41.9%, a difference of 0.20%), Liberian (41.8%, a difference of 0.34%), French (42.1%, a difference of 0.35%), and Immigrants from Bosnia and Herzegovina (41.8%, a difference of 0.42%).
| Demographics | Rating | Rank | In Labor Force | Age 16-19 |
| French | 100.0 /100 | #29 | Exceptional 42.1% |
| Scottish | 100.0 /100 | #30 | Exceptional 42.0% |
| Irish | 100.0 /100 | #31 | Exceptional 42.0% |
| Czechoslovakians | 100.0 /100 | #32 | Exceptional 41.9% |
| Liberians | 100.0 /100 | #33 | Exceptional 41.8% |
| Immigrants | Bosnia and Herzegovina | 100.0 /100 | #34 | Exceptional 41.8% |
| Yugoslavians | 100.0 /100 | #35 | Exceptional 41.8% |
| Immigrants | Azores | 100.0 /100 | #36 | Exceptional 41.7% |
| Immigrants | Congo | 100.0 /100 | #37 | Exceptional 41.7% |
| Sioux | 100.0 /100 | #38 | Exceptional 41.5% |
| Scotch-Irish | 100.0 /100 | #39 | Exceptional 41.5% |
| Immigrants | Liberia | 100.0 /100 | #40 | Exceptional 41.5% |
| Celtics | 100.0 /100 | #41 | Exceptional 41.3% |
| Whites/Caucasians | 100.0 /100 | #42 | Exceptional 41.3% |
| Tongans | 100.0 /100 | #43 | Exceptional 41.2% |
| Europeans | 100.0 /100 | #44 | Exceptional 41.1% |
| Croatians | 100.0 /100 | #45 | Exceptional 41.1% |
| Immigrants | Sudan | 100.0 /100 | #46 | Exceptional 41.0% |
| Carpatho Rusyns | 100.0 /100 | #47 | Exceptional 40.8% |
| Icelanders | 100.0 /100 | #48 | Exceptional 40.8% |
| Cree | 100.0 /100 | #49 | Exceptional 40.8% |