Tohono O'odham vs Slovene In Labor Force | Age 20-64
COMPARE
Tohono O'odham
Slovene
In Labor Force | Age 20-64
In Labor Force | Age 20-64 Comparison
Tohono O'odham
Slovenes
70.4%
IN LABOR FORCE | AGE 20-64
0.0/ 100
METRIC RATING
345th/ 347
METRIC RANK
80.5%
IN LABOR FORCE | AGE 20-64
99.7/ 100
METRIC RATING
45th/ 347
METRIC RANK
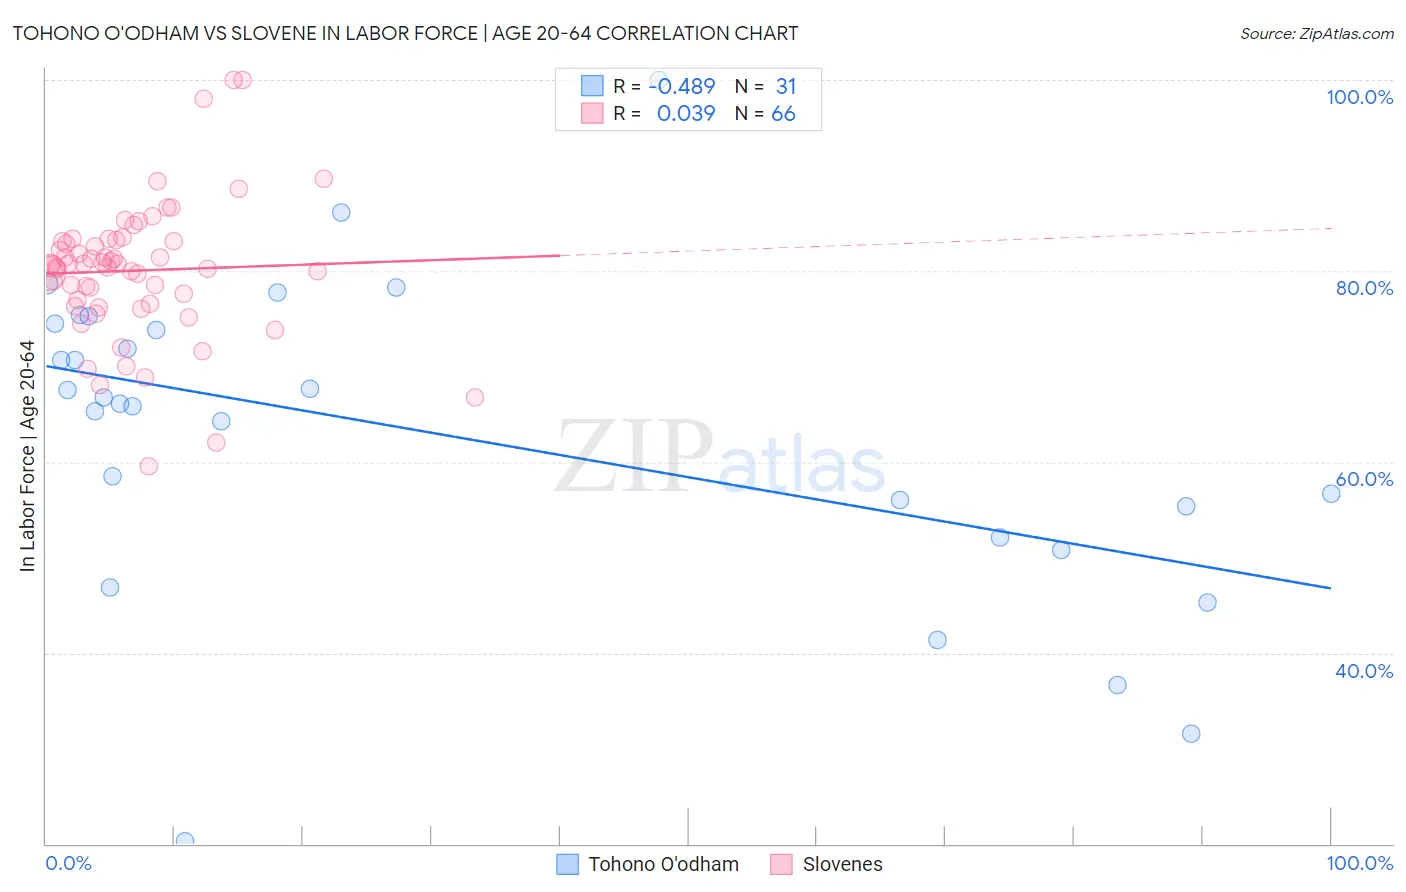
Tohono O'odham vs Slovene In Labor Force | Age 20-64 Correlation Chart
The statistical analysis conducted on geographies consisting of 58,725,287 people shows a moderate negative correlation between the proportion of Tohono O'odham and labor force participation rate among population between the ages 20 and 64 in the United States with a correlation coefficient (R) of -0.489 and weighted average of 70.4%. Similarly, the statistical analysis conducted on geographies consisting of 261,356,284 people shows no correlation between the proportion of Slovenes and labor force participation rate among population between the ages 20 and 64 in the United States with a correlation coefficient (R) of 0.039 and weighted average of 80.5%, a difference of 14.3%.
In Labor Force | Age 20-64 Correlation Summary
| Measurement | Tohono O'odham | Slovene |
| Minimum | 20.2% | 59.5% |
| Maximum | 100.0% | 100.0% |
| Range | 79.8% | 40.5% |
| Mean | 62.8% | 80.0% |
| Median | 66.1% | 80.6% |
| Interquartile 25% (IQ1) | 52.1% | 76.6% |
| Interquartile 75% (IQ3) | 74.5% | 83.1% |
| Interquartile Range (IQR) | 22.4% | 6.5% |
| Standard Deviation (Sample) | 16.8% | 7.2% |
| Standard Deviation (Population) | 16.5% | 7.2% |
Similar Demographics by In Labor Force | Age 20-64
Demographics Similar to Tohono O'odham by In Labor Force | Age 20-64
In terms of in labor force | age 20-64, the demographic groups most similar to Tohono O'odham are Lumbee (70.6%, a difference of 0.33%), Navajo (69.2%, a difference of 1.8%), Hopi (71.7%, a difference of 1.9%), Yuman (71.7%, a difference of 1.9%), and Pima (69.0%, a difference of 2.0%).
| Demographics | Rating | Rank | In Labor Force | Age 20-64 |
| Natives/Alaskans | 0.0 /100 | #333 | Tragic 73.9% |
| Apache | 0.0 /100 | #334 | Tragic 73.7% |
| Ute | 0.0 /100 | #335 | Tragic 73.7% |
| Crow | 0.0 /100 | #336 | Tragic 73.3% |
| Yup'ik | 0.0 /100 | #337 | Tragic 73.2% |
| Puerto Ricans | 0.0 /100 | #338 | Tragic 73.1% |
| Houma | 0.0 /100 | #339 | Tragic 72.7% |
| Pueblo | 0.0 /100 | #340 | Tragic 72.6% |
| Immigrants | Yemen | 0.0 /100 | #341 | Tragic 72.3% |
| Yuman | 0.0 /100 | #342 | Tragic 71.7% |
| Hopi | 0.0 /100 | #343 | Tragic 71.7% |
| Lumbee | 0.0 /100 | #344 | Tragic 70.6% |
| Tohono O'odham | 0.0 /100 | #345 | Tragic 70.4% |
| Navajo | 0.0 /100 | #346 | Tragic 69.2% |
| Pima | 0.0 /100 | #347 | Tragic 69.0% |
Demographics Similar to Slovenes by In Labor Force | Age 20-64
In terms of in labor force | age 20-64, the demographic groups most similar to Slovenes are Immigrants from Pakistan (80.5%, a difference of 0.010%), Immigrants from Middle Africa (80.5%, a difference of 0.020%), Immigrants from Africa (80.4%, a difference of 0.040%), Czech (80.5%, a difference of 0.060%), and Immigrants from Hong Kong (80.4%, a difference of 0.060%).
| Demographics | Rating | Rank | In Labor Force | Age 20-64 |
| Ugandans | 99.8 /100 | #38 | Exceptional 80.6% |
| Brazilians | 99.8 /100 | #39 | Exceptional 80.5% |
| Immigrants | Zimbabwe | 99.8 /100 | #40 | Exceptional 80.5% |
| Immigrants | Liberia | 99.8 /100 | #41 | Exceptional 80.5% |
| Latvians | 99.8 /100 | #42 | Exceptional 80.5% |
| Czechs | 99.7 /100 | #43 | Exceptional 80.5% |
| Immigrants | Middle Africa | 99.7 /100 | #44 | Exceptional 80.5% |
| Slovenes | 99.7 /100 | #45 | Exceptional 80.5% |
| Immigrants | Pakistan | 99.6 /100 | #46 | Exceptional 80.5% |
| Immigrants | Africa | 99.6 /100 | #47 | Exceptional 80.4% |
| Immigrants | Hong Kong | 99.5 /100 | #48 | Exceptional 80.4% |
| Immigrants | Greece | 99.4 /100 | #49 | Exceptional 80.4% |
| Immigrants | Sudan | 99.4 /100 | #50 | Exceptional 80.4% |
| Immigrants | Sri Lanka | 99.3 /100 | #51 | Exceptional 80.4% |
| Turks | 99.2 /100 | #52 | Exceptional 80.3% |