Tlingit-Haida vs Immigrants from Thailand In Labor Force | Age 16-19
COMPARE
Tlingit-Haida
Immigrants from Thailand
In Labor Force | Age 16-19
In Labor Force | Age 16-19 Comparison
Tlingit-Haida
Immigrants from Thailand
40.5%
IN LABOR FORCE | AGE 16-19
100.0/ 100
METRIC RATING
54th/ 347
METRIC RANK
38.7%
IN LABOR FORCE | AGE 16-19
99.1/ 100
METRIC RATING
100th/ 347
METRIC RANK
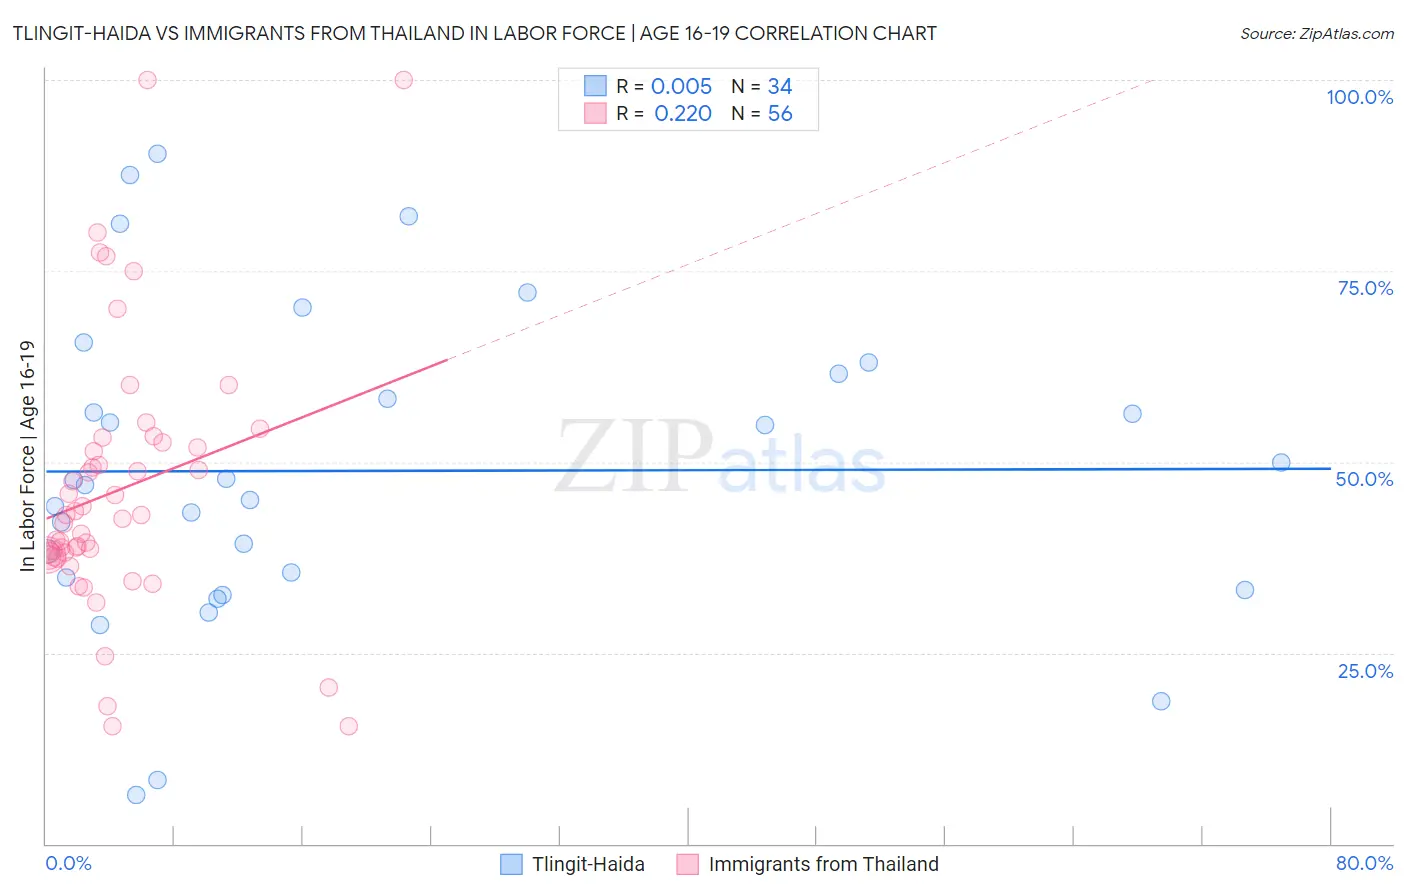
Tlingit-Haida vs Immigrants from Thailand In Labor Force | Age 16-19 Correlation Chart
The statistical analysis conducted on geographies consisting of 60,837,645 people shows no correlation between the proportion of Tlingit-Haida and labor force participation rate among population between the ages 16 and 19 in the United States with a correlation coefficient (R) of 0.005 and weighted average of 40.5%. Similarly, the statistical analysis conducted on geographies consisting of 316,722,585 people shows a weak positive correlation between the proportion of Immigrants from Thailand and labor force participation rate among population between the ages 16 and 19 in the United States with a correlation coefficient (R) of 0.220 and weighted average of 38.7%, a difference of 4.5%.
In Labor Force | Age 16-19 Correlation Summary
| Measurement | Tlingit-Haida | Immigrants from Thailand |
| Minimum | 6.4% | 15.4% |
| Maximum | 90.3% | 100.0% |
| Range | 83.9% | 84.6% |
| Mean | 48.8% | 46.3% |
| Median | 47.3% | 42.8% |
| Interquartile 25% (IQ1) | 34.8% | 37.7% |
| Interquartile 75% (IQ3) | 61.5% | 52.2% |
| Interquartile Range (IQR) | 26.7% | 14.5% |
| Standard Deviation (Sample) | 20.5% | 17.4% |
| Standard Deviation (Population) | 20.2% | 17.3% |
Similar Demographics by In Labor Force | Age 16-19
Demographics Similar to Tlingit-Haida by In Labor Force | Age 16-19
In terms of in labor force | age 16-19, the demographic groups most similar to Tlingit-Haida are Immigrants from Kenya (40.5%, a difference of 0.030%), British (40.5%, a difference of 0.030%), Fijian (40.4%, a difference of 0.12%), Lithuanian (40.4%, a difference of 0.14%), and Aleut (40.4%, a difference of 0.16%).
| Demographics | Rating | Rank | In Labor Force | Age 16-19 |
| Carpatho Rusyns | 100.0 /100 | #47 | Exceptional 40.8% |
| Icelanders | 100.0 /100 | #48 | Exceptional 40.8% |
| Cree | 100.0 /100 | #49 | Exceptional 40.8% |
| Indonesians | 100.0 /100 | #50 | Exceptional 40.7% |
| Immigrants | Zaire | 100.0 /100 | #51 | Exceptional 40.7% |
| Immigrants | Laos | 100.0 /100 | #52 | Exceptional 40.6% |
| Immigrants | Kenya | 100.0 /100 | #53 | Exceptional 40.5% |
| Tlingit-Haida | 100.0 /100 | #54 | Exceptional 40.5% |
| British | 100.0 /100 | #55 | Exceptional 40.5% |
| Fijians | 100.0 /100 | #56 | Exceptional 40.4% |
| Lithuanians | 100.0 /100 | #57 | Exceptional 40.4% |
| Aleuts | 100.0 /100 | #58 | Exceptional 40.4% |
| Slavs | 100.0 /100 | #59 | Exceptional 40.4% |
| Immigrants | Eastern Africa | 100.0 /100 | #60 | Exceptional 40.4% |
| Americans | 100.0 /100 | #61 | Exceptional 40.3% |
Demographics Similar to Immigrants from Thailand by In Labor Force | Age 16-19
In terms of in labor force | age 16-19, the demographic groups most similar to Immigrants from Thailand are Hmong (38.7%, a difference of 0.070%), Zimbabwean (38.7%, a difference of 0.070%), Immigrants from Cameroon (38.7%, a difference of 0.11%), Immigrants from Eritrea (38.7%, a difference of 0.16%), and Immigrants from North Macedonia (38.9%, a difference of 0.29%).
| Demographics | Rating | Rank | In Labor Force | Age 16-19 |
| Blackfeet | 99.4 /100 | #93 | Exceptional 38.9% |
| Immigrants | Canada | 99.4 /100 | #94 | Exceptional 38.9% |
| Immigrants | North America | 99.4 /100 | #95 | Exceptional 38.9% |
| Latvians | 99.4 /100 | #96 | Exceptional 38.9% |
| Greeks | 99.3 /100 | #97 | Exceptional 38.9% |
| Ugandans | 99.3 /100 | #98 | Exceptional 38.9% |
| Immigrants | North Macedonia | 99.3 /100 | #99 | Exceptional 38.9% |
| Immigrants | Thailand | 99.1 /100 | #100 | Exceptional 38.7% |
| Hmong | 99.1 /100 | #101 | Exceptional 38.7% |
| Zimbabweans | 99.1 /100 | #102 | Exceptional 38.7% |
| Immigrants | Cameroon | 99.0 /100 | #103 | Exceptional 38.7% |
| Immigrants | Eritrea | 99.0 /100 | #104 | Exceptional 38.7% |
| Iraqis | 98.9 /100 | #105 | Exceptional 38.6% |
| Delaware | 98.8 /100 | #106 | Exceptional 38.6% |
| Chinese | 98.8 /100 | #107 | Exceptional 38.6% |