Tlingit-Haida vs Immigrants from Bahamas In Labor Force | Age 16-19
COMPARE
Tlingit-Haida
Immigrants from Bahamas
In Labor Force | Age 16-19
In Labor Force | Age 16-19 Comparison
Tlingit-Haida
Immigrants from Bahamas
40.5%
IN LABOR FORCE | AGE 16-19
100.0/ 100
METRIC RATING
54th/ 347
METRIC RANK
35.5%
IN LABOR FORCE | AGE 16-19
8.3/ 100
METRIC RATING
220th/ 347
METRIC RANK
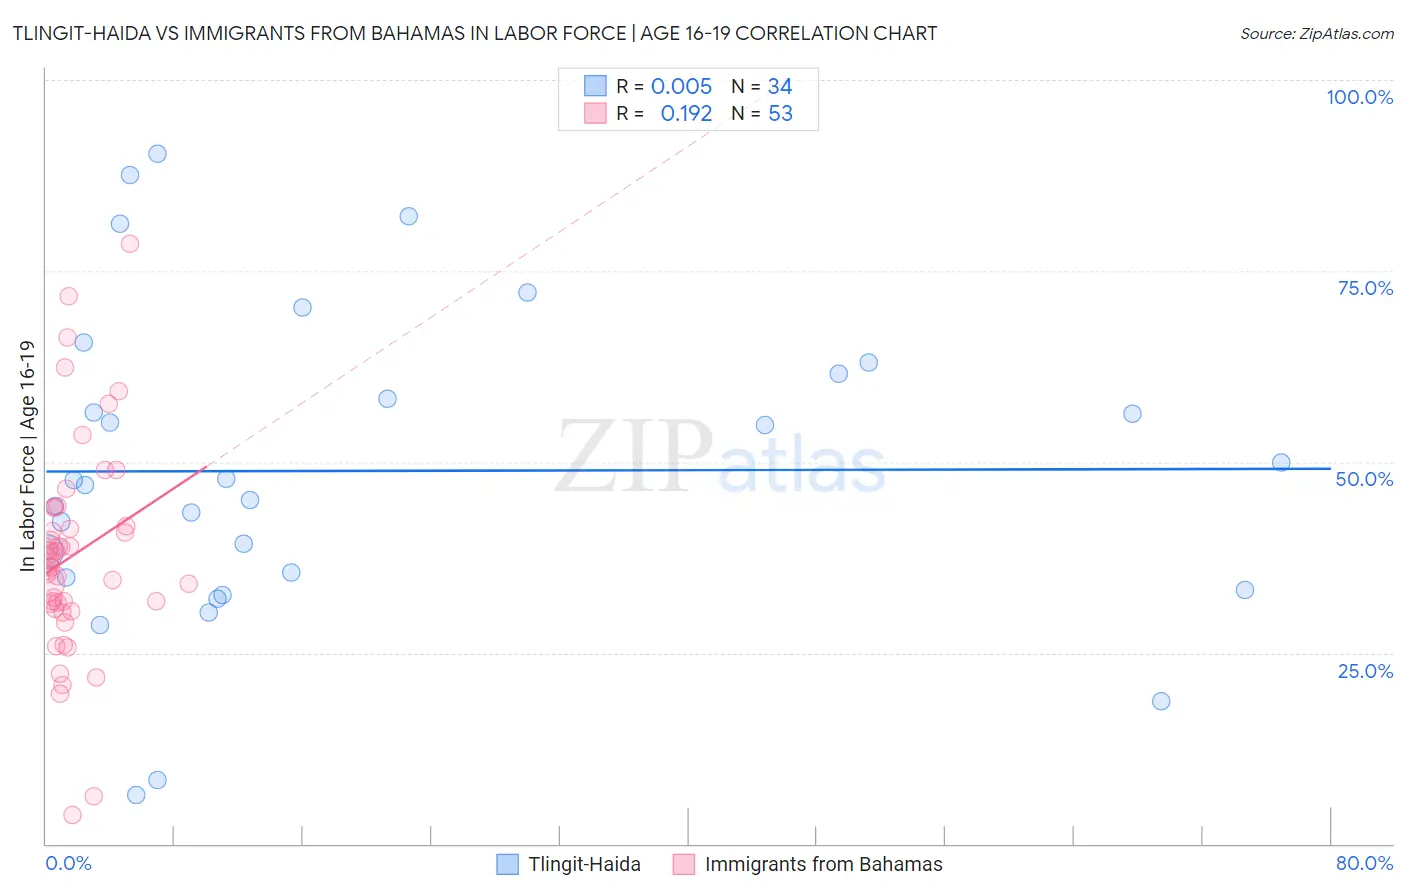
Tlingit-Haida vs Immigrants from Bahamas In Labor Force | Age 16-19 Correlation Chart
The statistical analysis conducted on geographies consisting of 60,837,645 people shows no correlation between the proportion of Tlingit-Haida and labor force participation rate among population between the ages 16 and 19 in the United States with a correlation coefficient (R) of 0.005 and weighted average of 40.5%. Similarly, the statistical analysis conducted on geographies consisting of 104,625,160 people shows a poor positive correlation between the proportion of Immigrants from Bahamas and labor force participation rate among population between the ages 16 and 19 in the United States with a correlation coefficient (R) of 0.192 and weighted average of 35.5%, a difference of 14.2%.
In Labor Force | Age 16-19 Correlation Summary
| Measurement | Tlingit-Haida | Immigrants from Bahamas |
| Minimum | 6.4% | 3.8% |
| Maximum | 90.3% | 78.5% |
| Range | 83.9% | 74.7% |
| Mean | 48.8% | 37.8% |
| Median | 47.3% | 36.7% |
| Interquartile 25% (IQ1) | 34.8% | 31.1% |
| Interquartile 75% (IQ3) | 61.5% | 42.7% |
| Interquartile Range (IQR) | 26.7% | 11.6% |
| Standard Deviation (Sample) | 20.5% | 13.9% |
| Standard Deviation (Population) | 20.2% | 13.7% |
Similar Demographics by In Labor Force | Age 16-19
Demographics Similar to Tlingit-Haida by In Labor Force | Age 16-19
In terms of in labor force | age 16-19, the demographic groups most similar to Tlingit-Haida are Immigrants from Kenya (40.5%, a difference of 0.030%), British (40.5%, a difference of 0.030%), Fijian (40.4%, a difference of 0.12%), Lithuanian (40.4%, a difference of 0.14%), and Aleut (40.4%, a difference of 0.16%).
| Demographics | Rating | Rank | In Labor Force | Age 16-19 |
| Carpatho Rusyns | 100.0 /100 | #47 | Exceptional 40.8% |
| Icelanders | 100.0 /100 | #48 | Exceptional 40.8% |
| Cree | 100.0 /100 | #49 | Exceptional 40.8% |
| Indonesians | 100.0 /100 | #50 | Exceptional 40.7% |
| Immigrants | Zaire | 100.0 /100 | #51 | Exceptional 40.7% |
| Immigrants | Laos | 100.0 /100 | #52 | Exceptional 40.6% |
| Immigrants | Kenya | 100.0 /100 | #53 | Exceptional 40.5% |
| Tlingit-Haida | 100.0 /100 | #54 | Exceptional 40.5% |
| British | 100.0 /100 | #55 | Exceptional 40.5% |
| Fijians | 100.0 /100 | #56 | Exceptional 40.4% |
| Lithuanians | 100.0 /100 | #57 | Exceptional 40.4% |
| Aleuts | 100.0 /100 | #58 | Exceptional 40.4% |
| Slavs | 100.0 /100 | #59 | Exceptional 40.4% |
| Immigrants | Eastern Africa | 100.0 /100 | #60 | Exceptional 40.4% |
| Americans | 100.0 /100 | #61 | Exceptional 40.3% |
Demographics Similar to Immigrants from Bahamas by In Labor Force | Age 16-19
In terms of in labor force | age 16-19, the demographic groups most similar to Immigrants from Bahamas are Guatemalan (35.5%, a difference of 0.060%), Turkish (35.4%, a difference of 0.18%), Immigrants from Ghana (35.4%, a difference of 0.19%), Sri Lankan (35.5%, a difference of 0.24%), and Ghanaian (35.3%, a difference of 0.33%).
| Demographics | Rating | Rank | In Labor Force | Age 16-19 |
| Immigrants | Bolivia | 11.0 /100 | #213 | Poor 35.6% |
| Apache | 11.0 /100 | #214 | Poor 35.6% |
| Immigrants | South Eastern Asia | 10.8 /100 | #215 | Poor 35.6% |
| Dutch West Indians | 10.7 /100 | #216 | Poor 35.6% |
| Immigrants | Costa Rica | 10.7 /100 | #217 | Poor 35.6% |
| Sri Lankans | 9.8 /100 | #218 | Tragic 35.5% |
| Guatemalans | 8.6 /100 | #219 | Tragic 35.5% |
| Immigrants | Bahamas | 8.3 /100 | #220 | Tragic 35.5% |
| Turks | 7.3 /100 | #221 | Tragic 35.4% |
| Immigrants | Ghana | 7.3 /100 | #222 | Tragic 35.4% |
| Ghanaians | 6.5 /100 | #223 | Tragic 35.3% |
| Hondurans | 6.5 /100 | #224 | Tragic 35.3% |
| Immigrants | Belgium | 6.1 /100 | #225 | Tragic 35.3% |
| Immigrants | Guatemala | 5.7 /100 | #226 | Tragic 35.3% |
| Mongolians | 5.7 /100 | #227 | Tragic 35.3% |