Immigrants from Nepal vs Immigrants from Thailand In Labor Force | Age 16-19
COMPARE
Immigrants from Nepal
Immigrants from Thailand
In Labor Force | Age 16-19
In Labor Force | Age 16-19 Comparison
Immigrants from Nepal
Immigrants from Thailand
38.3%
IN LABOR FORCE | AGE 16-19
97.8/ 100
METRIC RATING
118th/ 347
METRIC RANK
38.7%
IN LABOR FORCE | AGE 16-19
99.1/ 100
METRIC RATING
100th/ 347
METRIC RANK
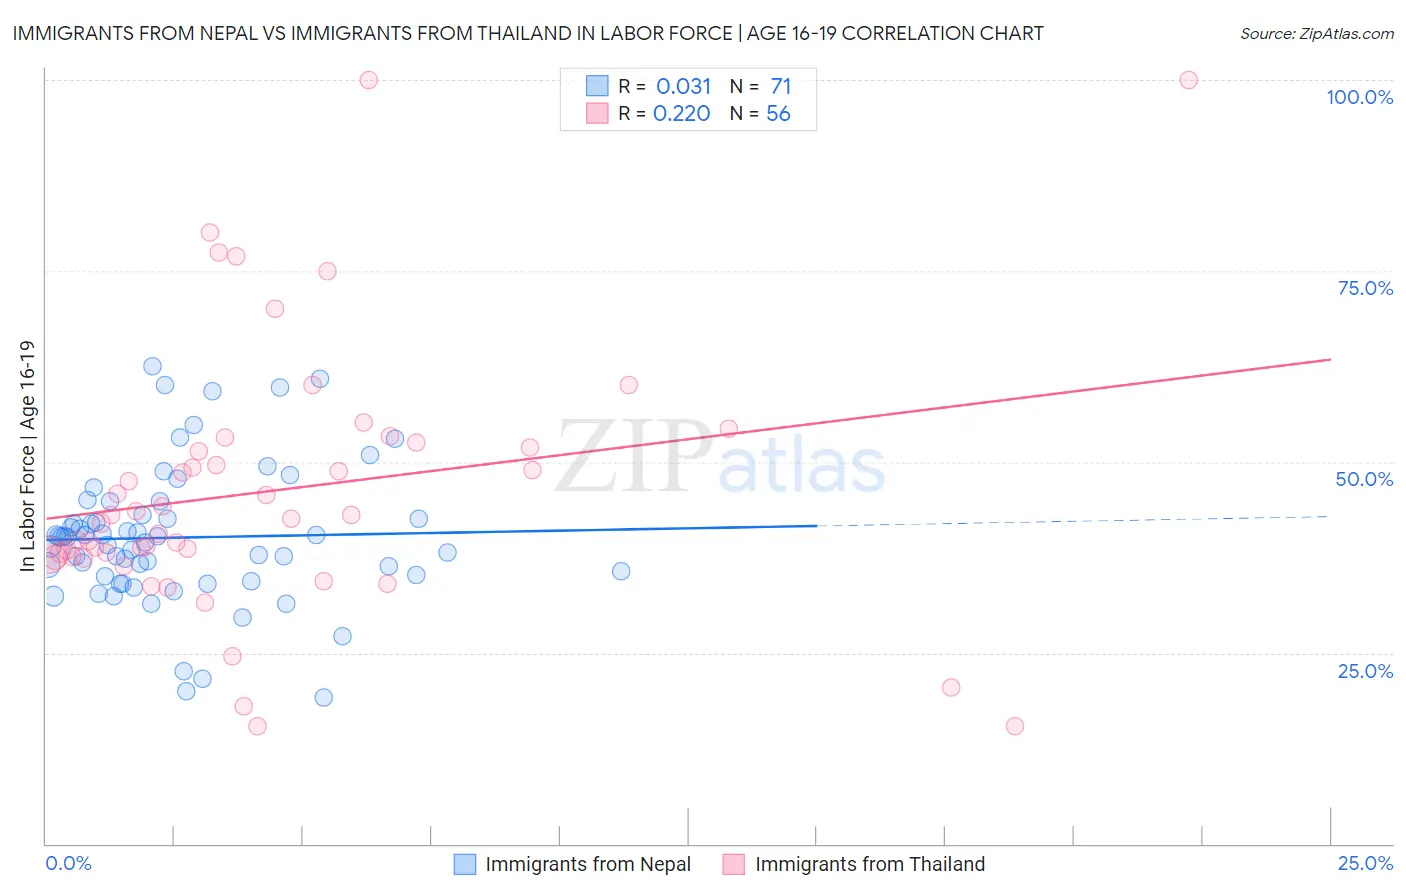
Immigrants from Nepal vs Immigrants from Thailand In Labor Force | Age 16-19 Correlation Chart
The statistical analysis conducted on geographies consisting of 186,763,001 people shows no correlation between the proportion of Immigrants from Nepal and labor force participation rate among population between the ages 16 and 19 in the United States with a correlation coefficient (R) of 0.031 and weighted average of 38.3%. Similarly, the statistical analysis conducted on geographies consisting of 316,722,585 people shows a weak positive correlation between the proportion of Immigrants from Thailand and labor force participation rate among population between the ages 16 and 19 in the United States with a correlation coefficient (R) of 0.220 and weighted average of 38.7%, a difference of 1.1%.
In Labor Force | Age 16-19 Correlation Summary
| Measurement | Immigrants from Nepal | Immigrants from Thailand |
| Minimum | 19.2% | 15.4% |
| Maximum | 62.5% | 100.0% |
| Range | 43.3% | 84.6% |
| Mean | 40.1% | 46.3% |
| Median | 40.1% | 42.8% |
| Interquartile 25% (IQ1) | 35.0% | 37.7% |
| Interquartile 75% (IQ3) | 43.1% | 52.2% |
| Interquartile Range (IQR) | 8.1% | 14.5% |
| Standard Deviation (Sample) | 9.0% | 17.4% |
| Standard Deviation (Population) | 9.0% | 17.3% |
Demographics Similar to Immigrants from Nepal and Immigrants from Thailand by In Labor Force | Age 16-19
In terms of in labor force | age 16-19, the demographic groups most similar to Immigrants from Nepal are Chickasaw (38.3%, a difference of 0.010%), Assyrian/Chaldean/Syriac (38.3%, a difference of 0.020%), Colville (38.3%, a difference of 0.060%), Bulgarian (38.3%, a difference of 0.070%), and Hawaiian (38.4%, a difference of 0.21%). Similarly, the demographic groups most similar to Immigrants from Thailand are Hmong (38.7%, a difference of 0.070%), Zimbabwean (38.7%, a difference of 0.070%), Immigrants from Cameroon (38.7%, a difference of 0.11%), Immigrants from Eritrea (38.7%, a difference of 0.16%), and Immigrants from North Macedonia (38.9%, a difference of 0.29%).
| Demographics | Rating | Rank | In Labor Force | Age 16-19 |
| Immigrants | North Macedonia | 99.3 /100 | #99 | Exceptional 38.9% |
| Immigrants | Thailand | 99.1 /100 | #100 | Exceptional 38.7% |
| Hmong | 99.1 /100 | #101 | Exceptional 38.7% |
| Zimbabweans | 99.1 /100 | #102 | Exceptional 38.7% |
| Immigrants | Cameroon | 99.0 /100 | #103 | Exceptional 38.7% |
| Immigrants | Eritrea | 99.0 /100 | #104 | Exceptional 38.7% |
| Iraqis | 98.9 /100 | #105 | Exceptional 38.6% |
| Delaware | 98.8 /100 | #106 | Exceptional 38.6% |
| Chinese | 98.8 /100 | #107 | Exceptional 38.6% |
| Immigrants | Ethiopia | 98.7 /100 | #108 | Exceptional 38.6% |
| Lebanese | 98.7 /100 | #109 | Exceptional 38.6% |
| Maltese | 98.6 /100 | #110 | Exceptional 38.5% |
| Crow | 98.5 /100 | #111 | Exceptional 38.5% |
| Immigrants | Scotland | 98.5 /100 | #112 | Exceptional 38.5% |
| Sub-Saharan Africans | 98.3 /100 | #113 | Exceptional 38.4% |
| Hawaiians | 98.2 /100 | #114 | Exceptional 38.4% |
| Bulgarians | 97.9 /100 | #115 | Exceptional 38.3% |
| Colville | 97.9 /100 | #116 | Exceptional 38.3% |
| Chickasaw | 97.8 /100 | #117 | Exceptional 38.3% |
| Immigrants | Nepal | 97.8 /100 | #118 | Exceptional 38.3% |
| Assyrians/Chaldeans/Syriacs | 97.8 /100 | #119 | Exceptional 38.3% |