Cypriot vs Immigrants from Thailand In Labor Force | Age 16-19
COMPARE
Cypriot
Immigrants from Thailand
In Labor Force | Age 16-19
In Labor Force | Age 16-19 Comparison
Cypriots
Immigrants from Thailand
33.8%
IN LABOR FORCE | AGE 16-19
0.3/ 100
METRIC RATING
281st/ 347
METRIC RANK
38.7%
IN LABOR FORCE | AGE 16-19
99.1/ 100
METRIC RATING
100th/ 347
METRIC RANK
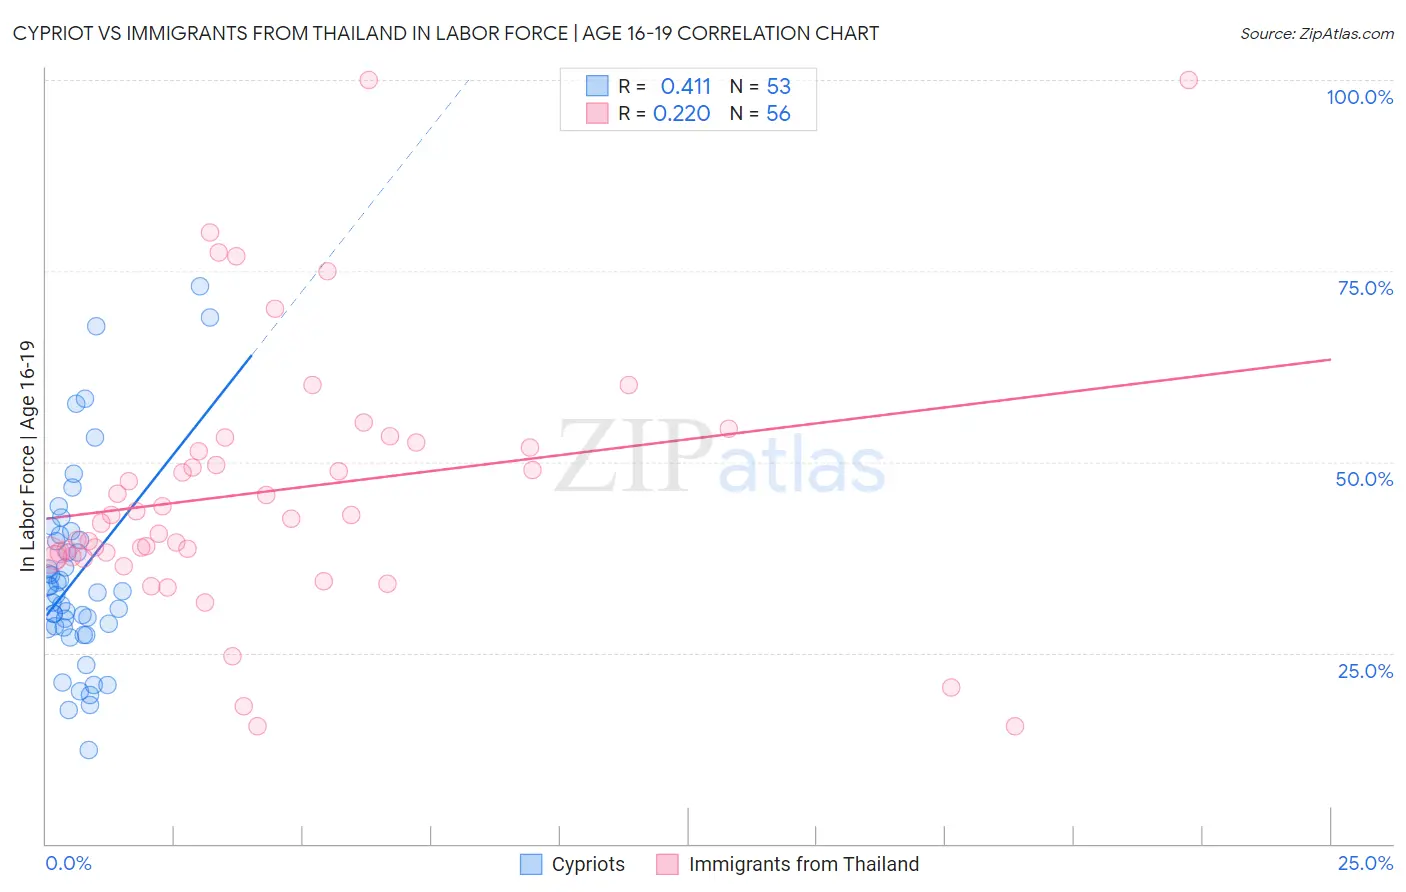
Cypriot vs Immigrants from Thailand In Labor Force | Age 16-19 Correlation Chart
The statistical analysis conducted on geographies consisting of 61,837,622 people shows a moderate positive correlation between the proportion of Cypriots and labor force participation rate among population between the ages 16 and 19 in the United States with a correlation coefficient (R) of 0.411 and weighted average of 33.8%. Similarly, the statistical analysis conducted on geographies consisting of 316,722,585 people shows a weak positive correlation between the proportion of Immigrants from Thailand and labor force participation rate among population between the ages 16 and 19 in the United States with a correlation coefficient (R) of 0.220 and weighted average of 38.7%, a difference of 14.5%.
In Labor Force | Age 16-19 Correlation Summary
| Measurement | Cypriot | Immigrants from Thailand |
| Minimum | 12.3% | 15.4% |
| Maximum | 73.0% | 100.0% |
| Range | 60.7% | 84.6% |
| Mean | 35.1% | 46.3% |
| Median | 32.9% | 42.8% |
| Interquartile 25% (IQ1) | 28.2% | 37.7% |
| Interquartile 75% (IQ3) | 40.1% | 52.2% |
| Interquartile Range (IQR) | 11.9% | 14.5% |
| Standard Deviation (Sample) | 12.8% | 17.4% |
| Standard Deviation (Population) | 12.7% | 17.3% |
Similar Demographics by In Labor Force | Age 16-19
Demographics Similar to Cypriots by In Labor Force | Age 16-19
In terms of in labor force | age 16-19, the demographic groups most similar to Cypriots are Paraguayan (33.8%, a difference of 0.010%), Taiwanese (33.8%, a difference of 0.010%), Immigrants from Korea (33.8%, a difference of 0.010%), Colombian (33.8%, a difference of 0.020%), and Menominee (33.9%, a difference of 0.10%).
| Demographics | Rating | Rank | In Labor Force | Age 16-19 |
| Venezuelans | 0.3 /100 | #274 | Tragic 34.0% |
| Immigrants | Fiji | 0.3 /100 | #275 | Tragic 33.9% |
| Immigrants | Latin America | 0.3 /100 | #276 | Tragic 33.9% |
| Menominee | 0.3 /100 | #277 | Tragic 33.9% |
| Colombians | 0.3 /100 | #278 | Tragic 33.8% |
| Paraguayans | 0.3 /100 | #279 | Tragic 33.8% |
| Taiwanese | 0.3 /100 | #280 | Tragic 33.8% |
| Cypriots | 0.3 /100 | #281 | Tragic 33.8% |
| Immigrants | Korea | 0.3 /100 | #282 | Tragic 33.8% |
| Immigrants | Venezuela | 0.2 /100 | #283 | Tragic 33.7% |
| Immigrants | Spain | 0.2 /100 | #284 | Tragic 33.7% |
| U.S. Virgin Islanders | 0.2 /100 | #285 | Tragic 33.6% |
| South Americans | 0.2 /100 | #286 | Tragic 33.6% |
| Nepalese | 0.1 /100 | #287 | Tragic 33.5% |
| Immigrants | Indonesia | 0.1 /100 | #288 | Tragic 33.5% |
Demographics Similar to Immigrants from Thailand by In Labor Force | Age 16-19
In terms of in labor force | age 16-19, the demographic groups most similar to Immigrants from Thailand are Hmong (38.7%, a difference of 0.070%), Zimbabwean (38.7%, a difference of 0.070%), Immigrants from Cameroon (38.7%, a difference of 0.11%), Immigrants from Eritrea (38.7%, a difference of 0.16%), and Immigrants from North Macedonia (38.9%, a difference of 0.29%).
| Demographics | Rating | Rank | In Labor Force | Age 16-19 |
| Blackfeet | 99.4 /100 | #93 | Exceptional 38.9% |
| Immigrants | Canada | 99.4 /100 | #94 | Exceptional 38.9% |
| Immigrants | North America | 99.4 /100 | #95 | Exceptional 38.9% |
| Latvians | 99.4 /100 | #96 | Exceptional 38.9% |
| Greeks | 99.3 /100 | #97 | Exceptional 38.9% |
| Ugandans | 99.3 /100 | #98 | Exceptional 38.9% |
| Immigrants | North Macedonia | 99.3 /100 | #99 | Exceptional 38.9% |
| Immigrants | Thailand | 99.1 /100 | #100 | Exceptional 38.7% |
| Hmong | 99.1 /100 | #101 | Exceptional 38.7% |
| Zimbabweans | 99.1 /100 | #102 | Exceptional 38.7% |
| Immigrants | Cameroon | 99.0 /100 | #103 | Exceptional 38.7% |
| Immigrants | Eritrea | 99.0 /100 | #104 | Exceptional 38.7% |
| Iraqis | 98.9 /100 | #105 | Exceptional 38.6% |
| Delaware | 98.8 /100 | #106 | Exceptional 38.6% |
| Chinese | 98.8 /100 | #107 | Exceptional 38.6% |