Tlingit-Haida vs Sioux In Labor Force | Age 30-34
COMPARE
Tlingit-Haida
Sioux
In Labor Force | Age 30-34
In Labor Force | Age 30-34 Comparison
Tlingit-Haida
Sioux
82.3%
IN LABOR FORCE | AGE 30-34
0.0/ 100
METRIC RATING
304th/ 347
METRIC RANK
80.4%
IN LABOR FORCE | AGE 30-34
0.0/ 100
METRIC RATING
328th/ 347
METRIC RANK
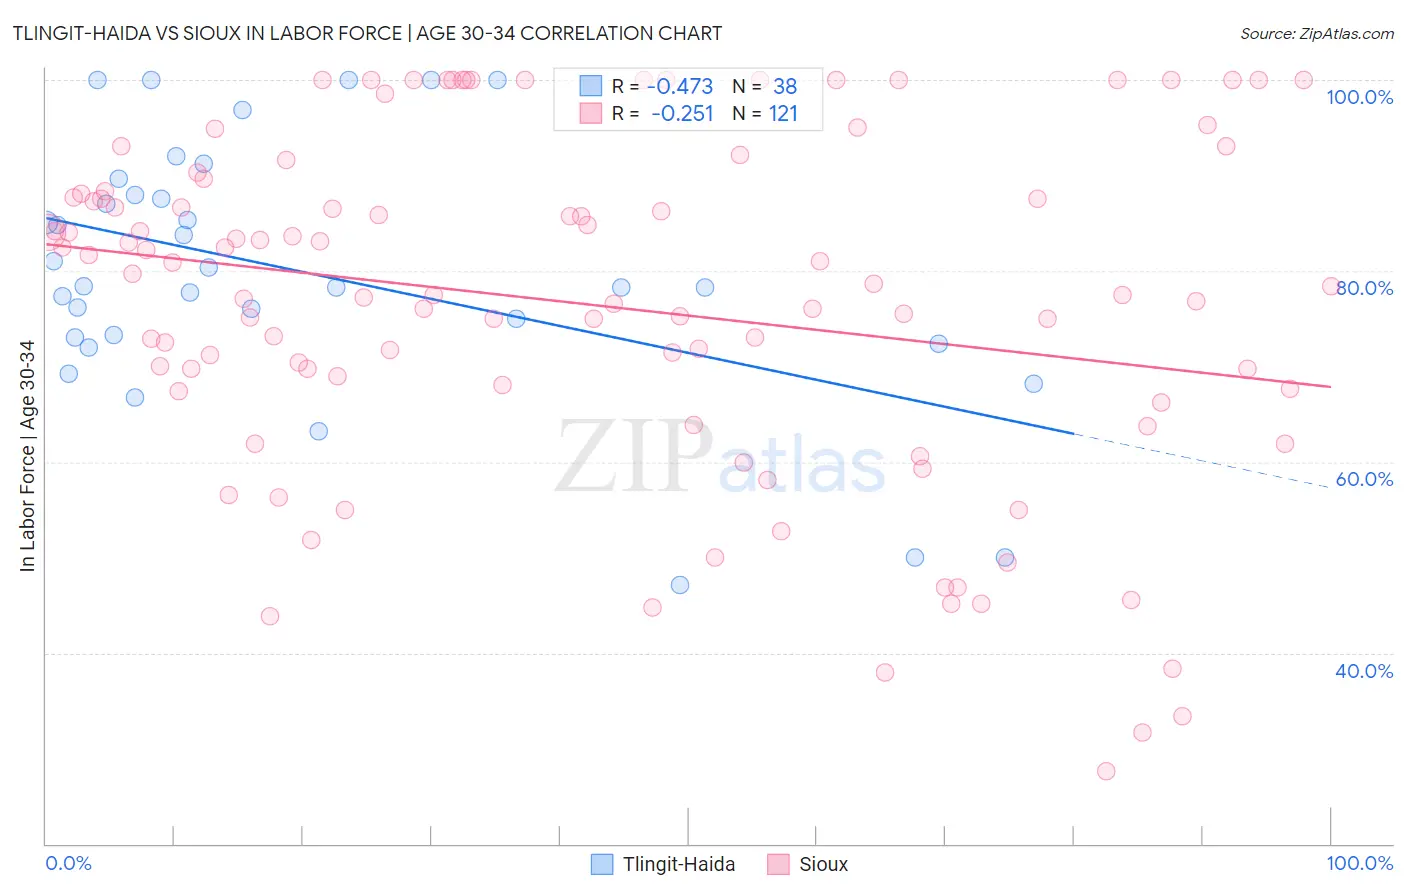
Tlingit-Haida vs Sioux In Labor Force | Age 30-34 Correlation Chart
The statistical analysis conducted on geographies consisting of 60,864,119 people shows a moderate negative correlation between the proportion of Tlingit-Haida and labor force participation rate among population between the ages 30 and 34 in the United States with a correlation coefficient (R) of -0.473 and weighted average of 82.3%. Similarly, the statistical analysis conducted on geographies consisting of 234,072,286 people shows a weak negative correlation between the proportion of Sioux and labor force participation rate among population between the ages 30 and 34 in the United States with a correlation coefficient (R) of -0.251 and weighted average of 80.4%, a difference of 2.4%.
In Labor Force | Age 30-34 Correlation Summary
| Measurement | Tlingit-Haida | Sioux |
| Minimum | 47.1% | 27.6% |
| Maximum | 100.0% | 100.0% |
| Range | 52.9% | 72.4% |
| Mean | 79.8% | 76.6% |
| Median | 78.3% | 78.4% |
| Interquartile 25% (IQ1) | 73.1% | 67.6% |
| Interquartile 75% (IQ3) | 88.0% | 88.2% |
| Interquartile Range (IQR) | 14.9% | 20.6% |
| Standard Deviation (Sample) | 13.6% | 17.9% |
| Standard Deviation (Population) | 13.4% | 17.8% |
Similar Demographics by In Labor Force | Age 30-34
Demographics Similar to Tlingit-Haida by In Labor Force | Age 30-34
In terms of in labor force | age 30-34, the demographic groups most similar to Tlingit-Haida are Immigrants from Micronesia (82.4%, a difference of 0.080%), Osage (82.3%, a difference of 0.080%), Ottawa (82.4%, a difference of 0.090%), Spanish American Indian (82.2%, a difference of 0.090%), and Hispanic or Latino (82.4%, a difference of 0.12%).
| Demographics | Rating | Rank | In Labor Force | Age 30-34 |
| Comanche | 0.0 /100 | #297 | Tragic 82.6% |
| Aleuts | 0.0 /100 | #298 | Tragic 82.6% |
| Immigrants | Central America | 0.0 /100 | #299 | Tragic 82.5% |
| Hmong | 0.0 /100 | #300 | Tragic 82.4% |
| Hispanics or Latinos | 0.0 /100 | #301 | Tragic 82.4% |
| Ottawa | 0.0 /100 | #302 | Tragic 82.4% |
| Immigrants | Micronesia | 0.0 /100 | #303 | Tragic 82.4% |
| Tlingit-Haida | 0.0 /100 | #304 | Tragic 82.3% |
| Osage | 0.0 /100 | #305 | Tragic 82.3% |
| Spanish American Indians | 0.0 /100 | #306 | Tragic 82.2% |
| Menominee | 0.0 /100 | #307 | Tragic 82.2% |
| Puget Sound Salish | 0.0 /100 | #308 | Tragic 82.1% |
| Immigrants | Mexico | 0.0 /100 | #309 | Tragic 82.0% |
| Cajuns | 0.0 /100 | #310 | Tragic 82.0% |
| Chickasaw | 0.0 /100 | #311 | Tragic 81.9% |
Demographics Similar to Sioux by In Labor Force | Age 30-34
In terms of in labor force | age 30-34, the demographic groups most similar to Sioux are Creek (80.4%, a difference of 0.010%), Colville (80.7%, a difference of 0.41%), Pueblo (80.0%, a difference of 0.41%), Houma (79.9%, a difference of 0.58%), and Seminole (80.8%, a difference of 0.60%).
| Demographics | Rating | Rank | In Labor Force | Age 30-34 |
| Alaska Natives | 0.0 /100 | #321 | Tragic 81.3% |
| Puerto Ricans | 0.0 /100 | #322 | Tragic 81.2% |
| Paiute | 0.0 /100 | #323 | Tragic 81.2% |
| Cheyenne | 0.0 /100 | #324 | Tragic 81.1% |
| Dutch West Indians | 0.0 /100 | #325 | Tragic 81.0% |
| Seminole | 0.0 /100 | #326 | Tragic 80.8% |
| Colville | 0.0 /100 | #327 | Tragic 80.7% |
| Sioux | 0.0 /100 | #328 | Tragic 80.4% |
| Creek | 0.0 /100 | #329 | Tragic 80.4% |
| Pueblo | 0.0 /100 | #330 | Tragic 80.0% |
| Houma | 0.0 /100 | #331 | Tragic 79.9% |
| Kiowa | 0.0 /100 | #332 | Tragic 79.8% |
| Inupiat | 0.0 /100 | #333 | Tragic 79.7% |
| Hopi | 0.0 /100 | #334 | Tragic 79.3% |
| Marshallese | 0.0 /100 | #335 | Tragic 79.2% |