Houma vs Immigrants from Iraq In Labor Force | Age 30-34
COMPARE
Houma
Immigrants from Iraq
In Labor Force | Age 30-34
In Labor Force | Age 30-34 Comparison
Houma
Immigrants from Iraq
79.9%
IN LABOR FORCE | AGE 30-34
0.0/ 100
METRIC RATING
331st/ 347
METRIC RANK
83.9%
IN LABOR FORCE | AGE 30-34
0.7/ 100
METRIC RATING
250th/ 347
METRIC RANK
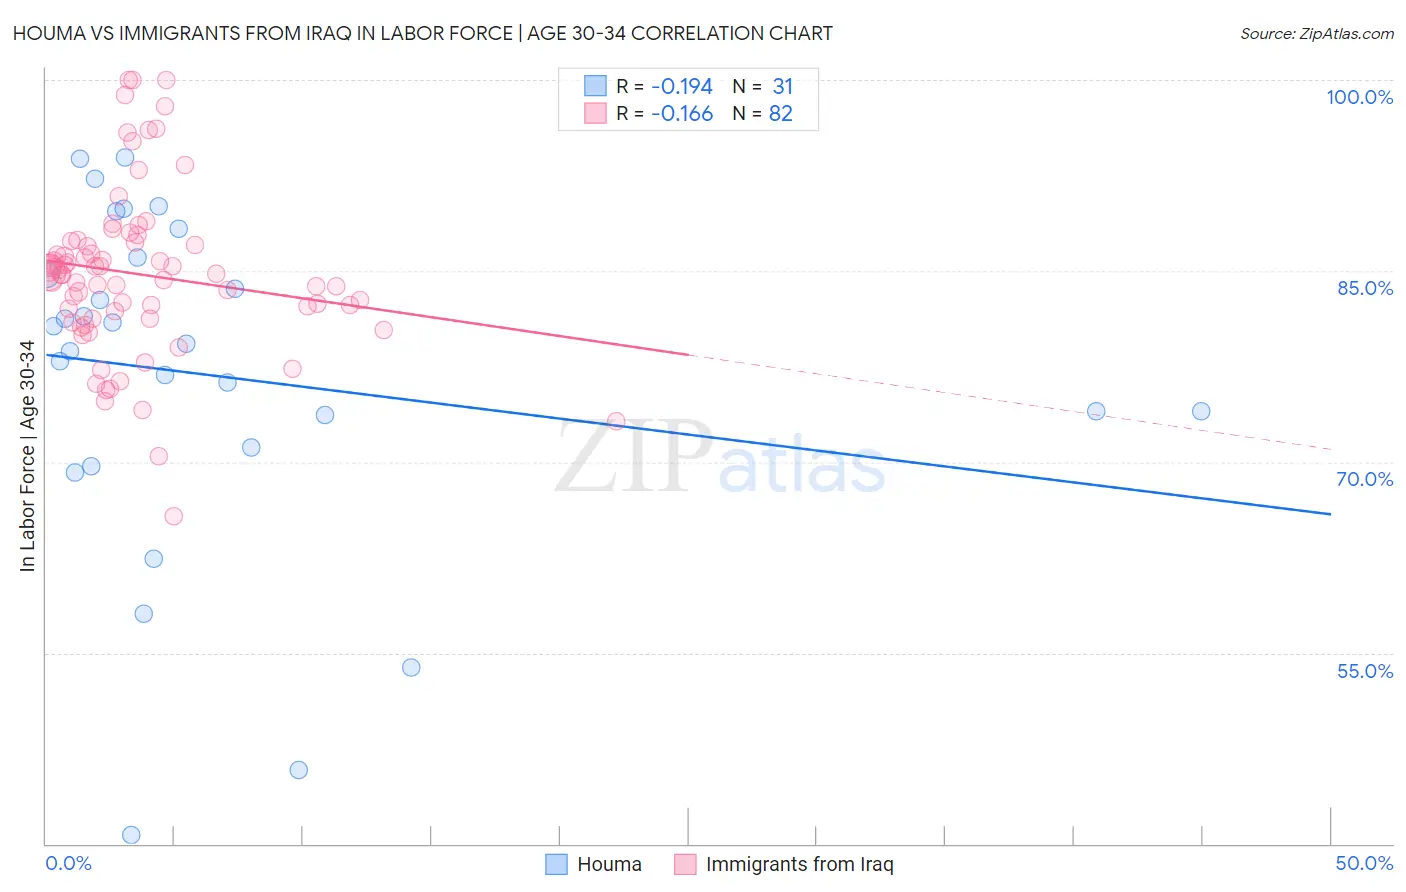
Houma vs Immigrants from Iraq In Labor Force | Age 30-34 Correlation Chart
The statistical analysis conducted on geographies consisting of 36,791,353 people shows a poor negative correlation between the proportion of Houma and labor force participation rate among population between the ages 30 and 34 in the United States with a correlation coefficient (R) of -0.194 and weighted average of 79.9%. Similarly, the statistical analysis conducted on geographies consisting of 194,759,411 people shows a poor negative correlation between the proportion of Immigrants from Iraq and labor force participation rate among population between the ages 30 and 34 in the United States with a correlation coefficient (R) of -0.166 and weighted average of 83.9%, a difference of 5.1%.
In Labor Force | Age 30-34 Correlation Summary
| Measurement | Houma | Immigrants from Iraq |
| Minimum | 40.7% | 65.7% |
| Maximum | 93.9% | 100.0% |
| Range | 53.2% | 34.3% |
| Mean | 76.8% | 84.7% |
| Median | 79.3% | 84.8% |
| Interquartile 25% (IQ1) | 71.1% | 81.2% |
| Interquartile 75% (IQ3) | 86.1% | 87.3% |
| Interquartile Range (IQR) | 15.0% | 6.0% |
| Standard Deviation (Sample) | 13.3% | 6.6% |
| Standard Deviation (Population) | 13.1% | 6.5% |
Similar Demographics by In Labor Force | Age 30-34
Demographics Similar to Houma by In Labor Force | Age 30-34
In terms of in labor force | age 30-34, the demographic groups most similar to Houma are Kiowa (79.8%, a difference of 0.11%), Pueblo (80.0%, a difference of 0.17%), Inupiat (79.7%, a difference of 0.22%), Sioux (80.4%, a difference of 0.58%), and Creek (80.4%, a difference of 0.58%).
| Demographics | Rating | Rank | In Labor Force | Age 30-34 |
| Cheyenne | 0.0 /100 | #324 | Tragic 81.1% |
| Dutch West Indians | 0.0 /100 | #325 | Tragic 81.0% |
| Seminole | 0.0 /100 | #326 | Tragic 80.8% |
| Colville | 0.0 /100 | #327 | Tragic 80.7% |
| Sioux | 0.0 /100 | #328 | Tragic 80.4% |
| Creek | 0.0 /100 | #329 | Tragic 80.4% |
| Pueblo | 0.0 /100 | #330 | Tragic 80.0% |
| Houma | 0.0 /100 | #331 | Tragic 79.9% |
| Kiowa | 0.0 /100 | #332 | Tragic 79.8% |
| Inupiat | 0.0 /100 | #333 | Tragic 79.7% |
| Hopi | 0.0 /100 | #334 | Tragic 79.3% |
| Marshallese | 0.0 /100 | #335 | Tragic 79.2% |
| Natives/Alaskans | 0.0 /100 | #336 | Tragic 79.2% |
| Yakama | 0.0 /100 | #337 | Tragic 79.1% |
| Pima | 0.0 /100 | #338 | Tragic 79.0% |
Demographics Similar to Immigrants from Iraq by In Labor Force | Age 30-34
In terms of in labor force | age 30-34, the demographic groups most similar to Immigrants from Iraq are Portuguese (84.0%, a difference of 0.020%), Immigrants from Dominica (84.0%, a difference of 0.020%), Nicaraguan (83.9%, a difference of 0.020%), Bahamian (83.9%, a difference of 0.020%), and Immigrants from Nicaragua (83.9%, a difference of 0.020%).
| Demographics | Rating | Rank | In Labor Force | Age 30-34 |
| Immigrants | Caribbean | 1.1 /100 | #243 | Tragic 84.0% |
| Basques | 0.9 /100 | #244 | Tragic 84.0% |
| Immigrants | Venezuela | 0.9 /100 | #245 | Tragic 84.0% |
| Central Americans | 0.9 /100 | #246 | Tragic 84.0% |
| British West Indians | 0.8 /100 | #247 | Tragic 84.0% |
| Portuguese | 0.8 /100 | #248 | Tragic 84.0% |
| Immigrants | Dominica | 0.7 /100 | #249 | Tragic 84.0% |
| Immigrants | Iraq | 0.7 /100 | #250 | Tragic 83.9% |
| Nicaraguans | 0.6 /100 | #251 | Tragic 83.9% |
| Bahamians | 0.6 /100 | #252 | Tragic 83.9% |
| Immigrants | Nicaragua | 0.6 /100 | #253 | Tragic 83.9% |
| Immigrants | St. Vincent and the Grenadines | 0.5 /100 | #254 | Tragic 83.9% |
| Whites/Caucasians | 0.5 /100 | #255 | Tragic 83.9% |
| Immigrants | Lebanon | 0.4 /100 | #256 | Tragic 83.9% |
| Iraqis | 0.3 /100 | #257 | Tragic 83.8% |