Tlingit-Haida vs Luxembourger In Labor Force | Age 30-34
COMPARE
Tlingit-Haida
Luxembourger
In Labor Force | Age 30-34
In Labor Force | Age 30-34 Comparison
Tlingit-Haida
Luxembourgers
82.3%
IN LABOR FORCE | AGE 30-34
0.0/ 100
METRIC RATING
304th/ 347
METRIC RANK
86.6%
IN LABOR FORCE | AGE 30-34
100.0/ 100
METRIC RATING
1st/ 347
METRIC RANK
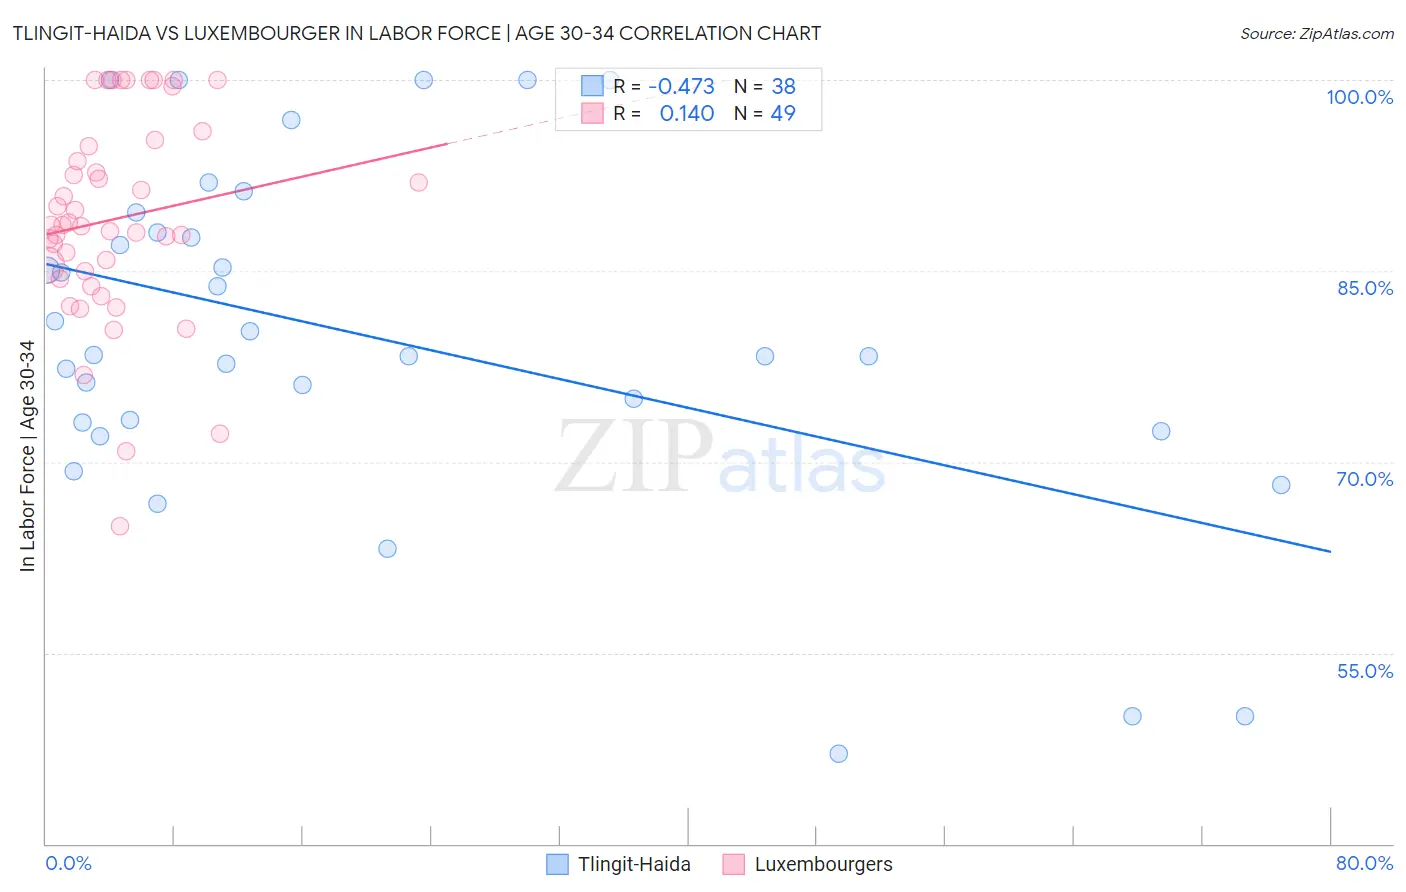
Tlingit-Haida vs Luxembourger In Labor Force | Age 30-34 Correlation Chart
The statistical analysis conducted on geographies consisting of 60,864,119 people shows a moderate negative correlation between the proportion of Tlingit-Haida and labor force participation rate among population between the ages 30 and 34 in the United States with a correlation coefficient (R) of -0.473 and weighted average of 82.3%. Similarly, the statistical analysis conducted on geographies consisting of 144,656,260 people shows a poor positive correlation between the proportion of Luxembourgers and labor force participation rate among population between the ages 30 and 34 in the United States with a correlation coefficient (R) of 0.140 and weighted average of 86.6%, a difference of 5.2%.
In Labor Force | Age 30-34 Correlation Summary
| Measurement | Tlingit-Haida | Luxembourger |
| Minimum | 47.1% | 64.9% |
| Maximum | 100.0% | 100.0% |
| Range | 52.9% | 35.1% |
| Mean | 79.8% | 89.1% |
| Median | 78.3% | 88.6% |
| Interquartile 25% (IQ1) | 73.1% | 84.7% |
| Interquartile 75% (IQ3) | 88.0% | 95.1% |
| Interquartile Range (IQR) | 14.9% | 10.4% |
| Standard Deviation (Sample) | 13.6% | 8.1% |
| Standard Deviation (Population) | 13.4% | 8.0% |
Similar Demographics by In Labor Force | Age 30-34
Demographics Similar to Tlingit-Haida by In Labor Force | Age 30-34
In terms of in labor force | age 30-34, the demographic groups most similar to Tlingit-Haida are Immigrants from Micronesia (82.4%, a difference of 0.080%), Osage (82.3%, a difference of 0.080%), Ottawa (82.4%, a difference of 0.090%), Spanish American Indian (82.2%, a difference of 0.090%), and Hispanic or Latino (82.4%, a difference of 0.12%).
| Demographics | Rating | Rank | In Labor Force | Age 30-34 |
| Comanche | 0.0 /100 | #297 | Tragic 82.6% |
| Aleuts | 0.0 /100 | #298 | Tragic 82.6% |
| Immigrants | Central America | 0.0 /100 | #299 | Tragic 82.5% |
| Hmong | 0.0 /100 | #300 | Tragic 82.4% |
| Hispanics or Latinos | 0.0 /100 | #301 | Tragic 82.4% |
| Ottawa | 0.0 /100 | #302 | Tragic 82.4% |
| Immigrants | Micronesia | 0.0 /100 | #303 | Tragic 82.4% |
| Tlingit-Haida | 0.0 /100 | #304 | Tragic 82.3% |
| Osage | 0.0 /100 | #305 | Tragic 82.3% |
| Spanish American Indians | 0.0 /100 | #306 | Tragic 82.2% |
| Menominee | 0.0 /100 | #307 | Tragic 82.2% |
| Puget Sound Salish | 0.0 /100 | #308 | Tragic 82.1% |
| Immigrants | Mexico | 0.0 /100 | #309 | Tragic 82.0% |
| Cajuns | 0.0 /100 | #310 | Tragic 82.0% |
| Chickasaw | 0.0 /100 | #311 | Tragic 81.9% |
Demographics Similar to Luxembourgers by In Labor Force | Age 30-34
In terms of in labor force | age 30-34, the demographic groups most similar to Luxembourgers are Ethiopian (86.6%, a difference of 0.070%), Immigrants from Ethiopia (86.6%, a difference of 0.080%), Liberian (86.4%, a difference of 0.28%), Immigrants from Ireland (86.3%, a difference of 0.42%), and Somali (86.2%, a difference of 0.45%).
| Demographics | Rating | Rank | In Labor Force | Age 30-34 |
| Luxembourgers | 100.0 /100 | #1 | Exceptional 86.6% |
| Ethiopians | 100.0 /100 | #2 | Exceptional 86.6% |
| Immigrants | Ethiopia | 100.0 /100 | #3 | Exceptional 86.6% |
| Liberians | 100.0 /100 | #4 | Exceptional 86.4% |
| Immigrants | Ireland | 100.0 /100 | #5 | Exceptional 86.3% |
| Somalis | 100.0 /100 | #6 | Exceptional 86.2% |
| Immigrants | Bolivia | 100.0 /100 | #7 | Exceptional 86.2% |
| Cambodians | 100.0 /100 | #8 | Exceptional 86.2% |
| Immigrants | Somalia | 100.0 /100 | #9 | Exceptional 86.2% |
| Immigrants | Serbia | 100.0 /100 | #10 | Exceptional 86.2% |
| Carpatho Rusyns | 100.0 /100 | #11 | Exceptional 86.2% |
| Bolivians | 100.0 /100 | #12 | Exceptional 86.1% |
| Immigrants | Croatia | 100.0 /100 | #13 | Exceptional 86.1% |
| Immigrants | Cabo Verde | 100.0 /100 | #14 | Exceptional 86.1% |
| Immigrants | Albania | 100.0 /100 | #15 | Exceptional 86.1% |