Belgian vs Immigrants from Iraq In Labor Force | Age 30-34
COMPARE
Belgian
Immigrants from Iraq
In Labor Force | Age 30-34
In Labor Force | Age 30-34 Comparison
Belgians
Immigrants from Iraq
85.2%
IN LABOR FORCE | AGE 30-34
97.2/ 100
METRIC RATING
99th/ 347
METRIC RANK
83.9%
IN LABOR FORCE | AGE 30-34
0.7/ 100
METRIC RATING
250th/ 347
METRIC RANK
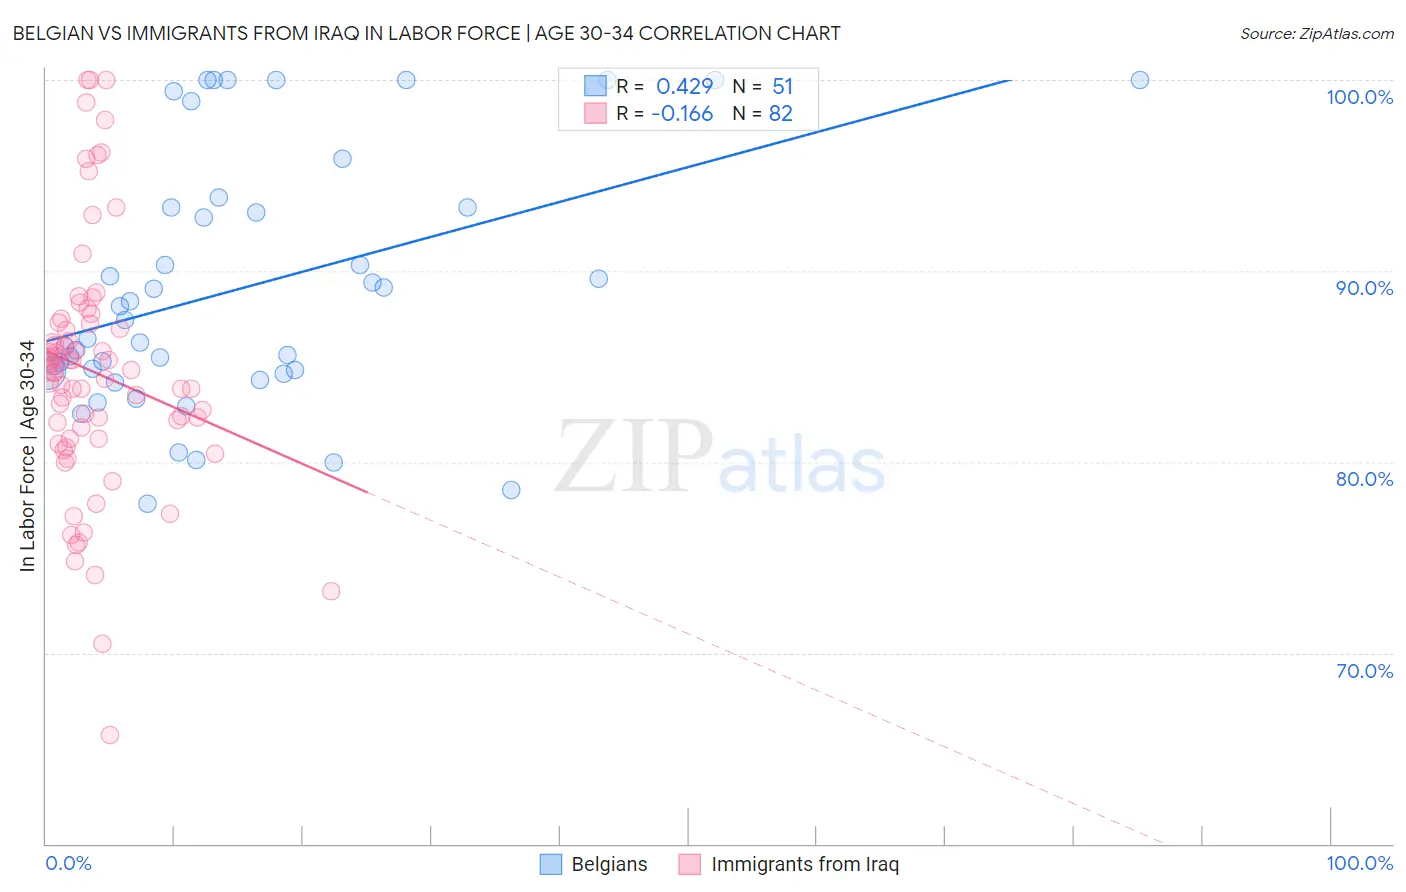
Belgian vs Immigrants from Iraq In Labor Force | Age 30-34 Correlation Chart
The statistical analysis conducted on geographies consisting of 355,822,490 people shows a moderate positive correlation between the proportion of Belgians and labor force participation rate among population between the ages 30 and 34 in the United States with a correlation coefficient (R) of 0.429 and weighted average of 85.2%. Similarly, the statistical analysis conducted on geographies consisting of 194,759,411 people shows a poor negative correlation between the proportion of Immigrants from Iraq and labor force participation rate among population between the ages 30 and 34 in the United States with a correlation coefficient (R) of -0.166 and weighted average of 83.9%, a difference of 1.5%.
In Labor Force | Age 30-34 Correlation Summary
| Measurement | Belgian | Immigrants from Iraq |
| Minimum | 77.8% | 65.7% |
| Maximum | 100.0% | 100.0% |
| Range | 22.2% | 34.3% |
| Mean | 89.1% | 84.7% |
| Median | 87.5% | 84.8% |
| Interquartile 25% (IQ1) | 84.7% | 81.2% |
| Interquartile 75% (IQ3) | 93.3% | 87.3% |
| Interquartile Range (IQR) | 8.6% | 6.0% |
| Standard Deviation (Sample) | 6.6% | 6.6% |
| Standard Deviation (Population) | 6.5% | 6.5% |
Similar Demographics by In Labor Force | Age 30-34
Demographics Similar to Belgians by In Labor Force | Age 30-34
In terms of in labor force | age 30-34, the demographic groups most similar to Belgians are Thai (85.2%, a difference of 0.0%), Immigrants from Uganda (85.2%, a difference of 0.0%), Sudanese (85.2%, a difference of 0.0%), Immigrants from Korea (85.2%, a difference of 0.010%), and Immigrants from Belarus (85.2%, a difference of 0.010%).
| Demographics | Rating | Rank | In Labor Force | Age 30-34 |
| German Russians | 97.7 /100 | #92 | Exceptional 85.2% |
| Immigrants | Norway | 97.6 /100 | #93 | Exceptional 85.2% |
| Swedes | 97.5 /100 | #94 | Exceptional 85.2% |
| Immigrants | India | 97.4 /100 | #95 | Exceptional 85.2% |
| Immigrants | Korea | 97.3 /100 | #96 | Exceptional 85.2% |
| Thais | 97.2 /100 | #97 | Exceptional 85.2% |
| Immigrants | Uganda | 97.2 /100 | #98 | Exceptional 85.2% |
| Belgians | 97.2 /100 | #99 | Exceptional 85.2% |
| Sudanese | 97.1 /100 | #100 | Exceptional 85.2% |
| Immigrants | Belarus | 96.9 /100 | #101 | Exceptional 85.2% |
| Immigrants | Austria | 96.8 /100 | #102 | Exceptional 85.2% |
| Ukrainians | 96.6 /100 | #103 | Exceptional 85.2% |
| Immigrants | Ghana | 96.5 /100 | #104 | Exceptional 85.2% |
| Alsatians | 96.3 /100 | #105 | Exceptional 85.2% |
| Immigrants | Middle Africa | 96.3 /100 | #106 | Exceptional 85.2% |
Demographics Similar to Immigrants from Iraq by In Labor Force | Age 30-34
In terms of in labor force | age 30-34, the demographic groups most similar to Immigrants from Iraq are Portuguese (84.0%, a difference of 0.020%), Immigrants from Dominica (84.0%, a difference of 0.020%), Nicaraguan (83.9%, a difference of 0.020%), Bahamian (83.9%, a difference of 0.020%), and Immigrants from Nicaragua (83.9%, a difference of 0.020%).
| Demographics | Rating | Rank | In Labor Force | Age 30-34 |
| Immigrants | Caribbean | 1.1 /100 | #243 | Tragic 84.0% |
| Basques | 0.9 /100 | #244 | Tragic 84.0% |
| Immigrants | Venezuela | 0.9 /100 | #245 | Tragic 84.0% |
| Central Americans | 0.9 /100 | #246 | Tragic 84.0% |
| British West Indians | 0.8 /100 | #247 | Tragic 84.0% |
| Portuguese | 0.8 /100 | #248 | Tragic 84.0% |
| Immigrants | Dominica | 0.7 /100 | #249 | Tragic 84.0% |
| Immigrants | Iraq | 0.7 /100 | #250 | Tragic 83.9% |
| Nicaraguans | 0.6 /100 | #251 | Tragic 83.9% |
| Bahamians | 0.6 /100 | #252 | Tragic 83.9% |
| Immigrants | Nicaragua | 0.6 /100 | #253 | Tragic 83.9% |
| Immigrants | St. Vincent and the Grenadines | 0.5 /100 | #254 | Tragic 83.9% |
| Whites/Caucasians | 0.5 /100 | #255 | Tragic 83.9% |
| Immigrants | Lebanon | 0.4 /100 | #256 | Tragic 83.9% |
| Iraqis | 0.3 /100 | #257 | Tragic 83.8% |