Choctaw vs Hawaiian In Labor Force | Age 20-24
COMPARE
Choctaw
Hawaiian
In Labor Force | Age 20-24
In Labor Force | Age 20-24 Comparison
Choctaw
Hawaiians
74.7%
IN LABOR FORCE | AGE 20-24
21.4/ 100
METRIC RATING
201st/ 347
METRIC RANK
77.0%
IN LABOR FORCE | AGE 20-24
99.9/ 100
METRIC RATING
58th/ 347
METRIC RANK
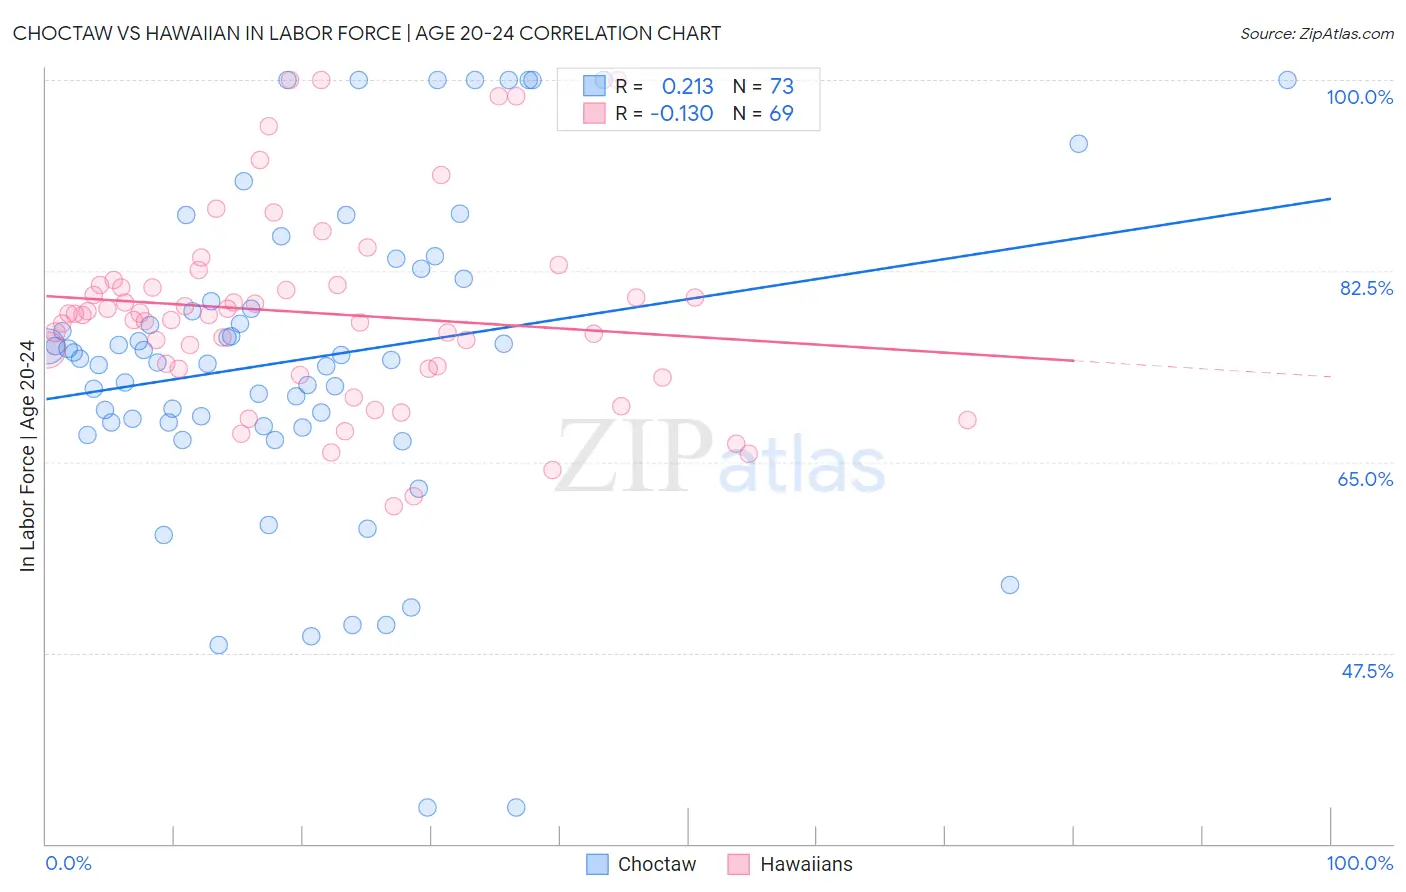
Choctaw vs Hawaiian In Labor Force | Age 20-24 Correlation Chart
The statistical analysis conducted on geographies consisting of 269,558,461 people shows a weak positive correlation between the proportion of Choctaw and labor force participation rate among population between the ages 20 and 24 in the United States with a correlation coefficient (R) of 0.213 and weighted average of 74.7%. Similarly, the statistical analysis conducted on geographies consisting of 327,479,725 people shows a poor negative correlation between the proportion of Hawaiians and labor force participation rate among population between the ages 20 and 24 in the United States with a correlation coefficient (R) of -0.130 and weighted average of 77.0%, a difference of 3.2%.
In Labor Force | Age 20-24 Correlation Summary
| Measurement | Choctaw | Hawaiian |
| Minimum | 33.3% | 60.9% |
| Maximum | 100.0% | 100.0% |
| Range | 66.7% | 39.1% |
| Mean | 74.5% | 78.6% |
| Median | 74.5% | 78.5% |
| Interquartile 25% (IQ1) | 68.4% | 73.5% |
| Interquartile 75% (IQ3) | 82.2% | 81.2% |
| Interquartile Range (IQR) | 13.8% | 7.7% |
| Standard Deviation (Sample) | 14.8% | 8.9% |
| Standard Deviation (Population) | 14.7% | 8.8% |
Similar Demographics by In Labor Force | Age 20-24
Demographics Similar to Choctaw by In Labor Force | Age 20-24
In terms of in labor force | age 20-24, the demographic groups most similar to Choctaw are Nigerian (74.7%, a difference of 0.010%), Moroccan (74.7%, a difference of 0.020%), Taiwanese (74.7%, a difference of 0.040%), Immigrants from Nigeria (74.7%, a difference of 0.060%), and Eastern European (74.8%, a difference of 0.080%).
| Demographics | Rating | Rank | In Labor Force | Age 20-24 |
| Immigrants | Denmark | 25.8 /100 | #194 | Fair 74.8% |
| Eastern Europeans | 25.4 /100 | #195 | Fair 74.8% |
| Immigrants | Vietnam | 25.1 /100 | #196 | Fair 74.7% |
| Panamanians | 25.0 /100 | #197 | Fair 74.7% |
| Immigrants | Nigeria | 24.2 /100 | #198 | Fair 74.7% |
| Taiwanese | 23.2 /100 | #199 | Fair 74.7% |
| Nigerians | 21.9 /100 | #200 | Fair 74.7% |
| Choctaw | 21.4 /100 | #201 | Fair 74.7% |
| Moroccans | 20.4 /100 | #202 | Fair 74.7% |
| Immigrants | Northern Africa | 17.9 /100 | #203 | Poor 74.6% |
| Immigrants | Italy | 17.6 /100 | #204 | Poor 74.6% |
| Inupiat | 17.6 /100 | #205 | Poor 74.6% |
| Sioux | 17.5 /100 | #206 | Poor 74.6% |
| Albanians | 16.2 /100 | #207 | Poor 74.6% |
| Immigrants | Uruguay | 15.8 /100 | #208 | Poor 74.6% |
Demographics Similar to Hawaiians by In Labor Force | Age 20-24
In terms of in labor force | age 20-24, the demographic groups most similar to Hawaiians are Chippewa (77.1%, a difference of 0.020%), Scotch-Irish (77.0%, a difference of 0.030%), Immigrants from Liberia (77.1%, a difference of 0.040%), European (77.1%, a difference of 0.040%), and Celtic (77.1%, a difference of 0.060%).
| Demographics | Rating | Rank | In Labor Force | Age 20-24 |
| Croatians | 100.0 /100 | #51 | Exceptional 77.2% |
| Indonesians | 100.0 /100 | #52 | Exceptional 77.2% |
| Immigrants | Azores | 100.0 /100 | #53 | Exceptional 77.2% |
| Celtics | 99.9 /100 | #54 | Exceptional 77.1% |
| Immigrants | Liberia | 99.9 /100 | #55 | Exceptional 77.1% |
| Europeans | 99.9 /100 | #56 | Exceptional 77.1% |
| Chippewa | 99.9 /100 | #57 | Exceptional 77.1% |
| Hawaiians | 99.9 /100 | #58 | Exceptional 77.0% |
| Scotch-Irish | 99.9 /100 | #59 | Exceptional 77.0% |
| Kenyans | 99.9 /100 | #60 | Exceptional 77.0% |
| Immigrants | Eritrea | 99.9 /100 | #61 | Exceptional 77.0% |
| Immigrants | Kenya | 99.9 /100 | #62 | Exceptional 77.0% |
| Lithuanians | 99.9 /100 | #63 | Exceptional 77.0% |
| Whites/Caucasians | 99.9 /100 | #64 | Exceptional 76.9% |
| Crow | 99.9 /100 | #65 | Exceptional 76.9% |