Venezuelan vs Hawaiian In Labor Force | Age 20-24
COMPARE
Venezuelan
Hawaiian
In Labor Force | Age 20-24
In Labor Force | Age 20-24 Comparison
Venezuelans
Hawaiians
73.3%
IN LABOR FORCE | AGE 20-24
0.2/ 100
METRIC RATING
279th/ 347
METRIC RANK
77.0%
IN LABOR FORCE | AGE 20-24
99.9/ 100
METRIC RATING
58th/ 347
METRIC RANK
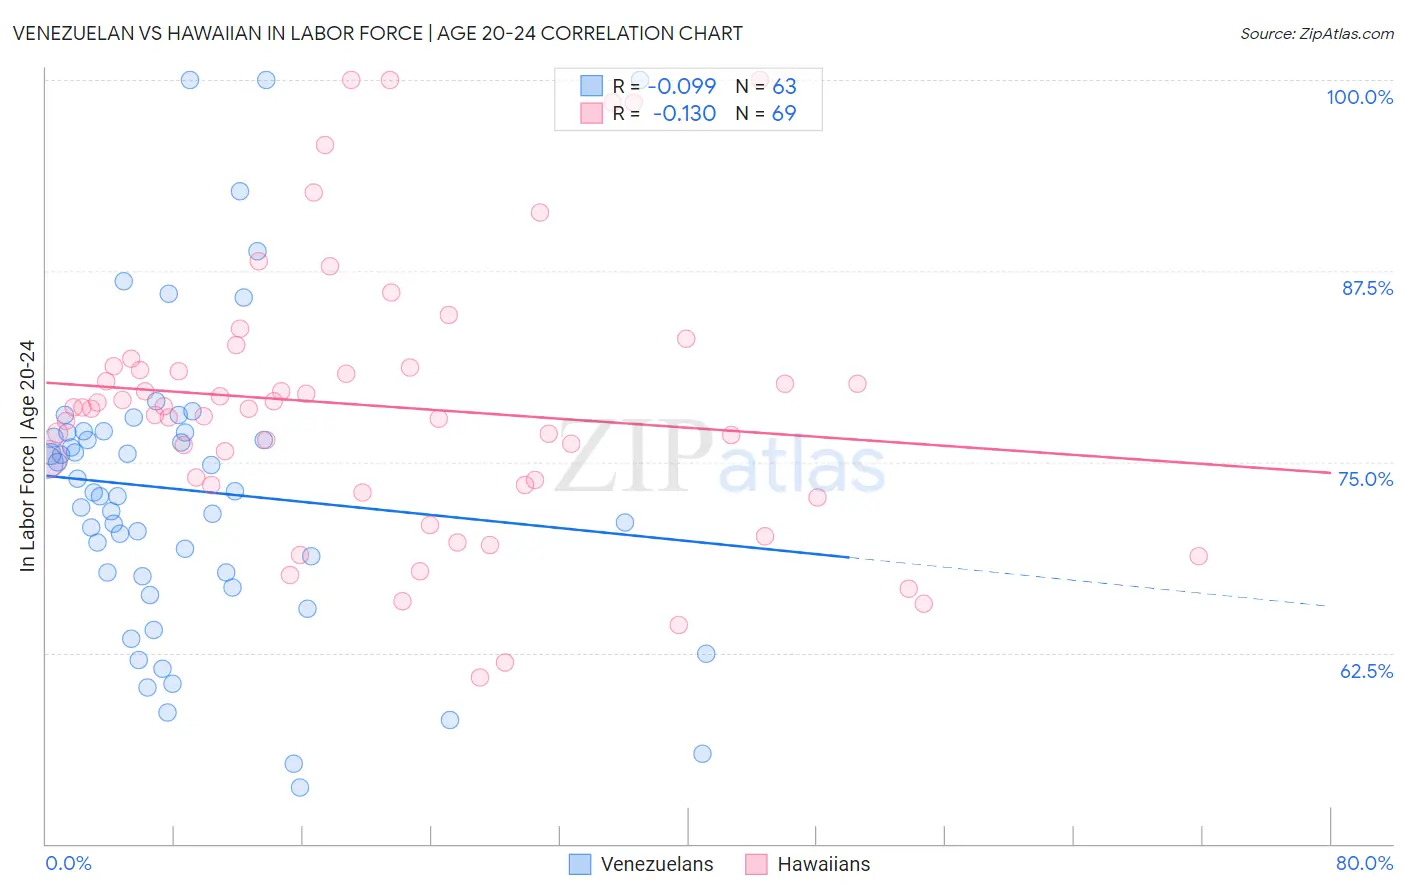
Venezuelan vs Hawaiian In Labor Force | Age 20-24 Correlation Chart
The statistical analysis conducted on geographies consisting of 306,312,696 people shows a slight negative correlation between the proportion of Venezuelans and labor force participation rate among population between the ages 20 and 24 in the United States with a correlation coefficient (R) of -0.099 and weighted average of 73.3%. Similarly, the statistical analysis conducted on geographies consisting of 327,479,725 people shows a poor negative correlation between the proportion of Hawaiians and labor force participation rate among population between the ages 20 and 24 in the United States with a correlation coefficient (R) of -0.130 and weighted average of 77.0%, a difference of 5.1%.
In Labor Force | Age 20-24 Correlation Summary
| Measurement | Venezuelan | Hawaiian |
| Minimum | 53.7% | 60.9% |
| Maximum | 100.0% | 100.0% |
| Range | 46.3% | 39.1% |
| Mean | 73.1% | 78.6% |
| Median | 73.0% | 78.5% |
| Interquartile 25% (IQ1) | 67.5% | 73.5% |
| Interquartile 75% (IQ3) | 76.9% | 81.2% |
| Interquartile Range (IQR) | 9.4% | 7.7% |
| Standard Deviation (Sample) | 10.0% | 8.9% |
| Standard Deviation (Population) | 9.9% | 8.8% |
Similar Demographics by In Labor Force | Age 20-24
Demographics Similar to Venezuelans by In Labor Force | Age 20-24
In terms of in labor force | age 20-24, the demographic groups most similar to Venezuelans are Cypriot (73.3%, a difference of 0.010%), Mongolian (73.3%, a difference of 0.030%), Immigrants from Malaysia (73.3%, a difference of 0.030%), Immigrants from South America (73.3%, a difference of 0.050%), and Bahamian (73.3%, a difference of 0.070%).
| Demographics | Rating | Rank | In Labor Force | Age 20-24 |
| Belizeans | 0.3 /100 | #272 | Tragic 73.4% |
| Cheyenne | 0.2 /100 | #273 | Tragic 73.4% |
| Immigrants | Colombia | 0.2 /100 | #274 | Tragic 73.4% |
| Immigrants | South America | 0.2 /100 | #275 | Tragic 73.3% |
| Mongolians | 0.2 /100 | #276 | Tragic 73.3% |
| Immigrants | Malaysia | 0.2 /100 | #277 | Tragic 73.3% |
| Cypriots | 0.2 /100 | #278 | Tragic 73.3% |
| Venezuelans | 0.2 /100 | #279 | Tragic 73.3% |
| Bahamians | 0.1 /100 | #280 | Tragic 73.3% |
| Immigrants | Venezuela | 0.1 /100 | #281 | Tragic 73.2% |
| Immigrants | Spain | 0.1 /100 | #282 | Tragic 73.2% |
| Immigrants | Bahamas | 0.1 /100 | #283 | Tragic 73.2% |
| Kiowa | 0.1 /100 | #284 | Tragic 73.2% |
| Nicaraguans | 0.1 /100 | #285 | Tragic 73.2% |
| Immigrants | Lebanon | 0.1 /100 | #286 | Tragic 73.1% |
Demographics Similar to Hawaiians by In Labor Force | Age 20-24
In terms of in labor force | age 20-24, the demographic groups most similar to Hawaiians are Chippewa (77.1%, a difference of 0.020%), Scotch-Irish (77.0%, a difference of 0.030%), Immigrants from Liberia (77.1%, a difference of 0.040%), European (77.1%, a difference of 0.040%), and Celtic (77.1%, a difference of 0.060%).
| Demographics | Rating | Rank | In Labor Force | Age 20-24 |
| Croatians | 100.0 /100 | #51 | Exceptional 77.2% |
| Indonesians | 100.0 /100 | #52 | Exceptional 77.2% |
| Immigrants | Azores | 100.0 /100 | #53 | Exceptional 77.2% |
| Celtics | 99.9 /100 | #54 | Exceptional 77.1% |
| Immigrants | Liberia | 99.9 /100 | #55 | Exceptional 77.1% |
| Europeans | 99.9 /100 | #56 | Exceptional 77.1% |
| Chippewa | 99.9 /100 | #57 | Exceptional 77.1% |
| Hawaiians | 99.9 /100 | #58 | Exceptional 77.0% |
| Scotch-Irish | 99.9 /100 | #59 | Exceptional 77.0% |
| Kenyans | 99.9 /100 | #60 | Exceptional 77.0% |
| Immigrants | Eritrea | 99.9 /100 | #61 | Exceptional 77.0% |
| Immigrants | Kenya | 99.9 /100 | #62 | Exceptional 77.0% |
| Lithuanians | 99.9 /100 | #63 | Exceptional 77.0% |
| Whites/Caucasians | 99.9 /100 | #64 | Exceptional 76.9% |
| Crow | 99.9 /100 | #65 | Exceptional 76.9% |