Thai vs Subsaharan African In Labor Force | Age 35-44
COMPARE
Thai
Subsaharan African
In Labor Force | Age 35-44
In Labor Force | Age 35-44 Comparison
Thais
Sub-Saharan Africans
85.2%
IN LABOR FORCE | AGE 35-44
99.7/ 100
METRIC RATING
50th/ 347
METRIC RANK
84.1%
IN LABOR FORCE | AGE 35-44
9.3/ 100
METRIC RATING
219th/ 347
METRIC RANK
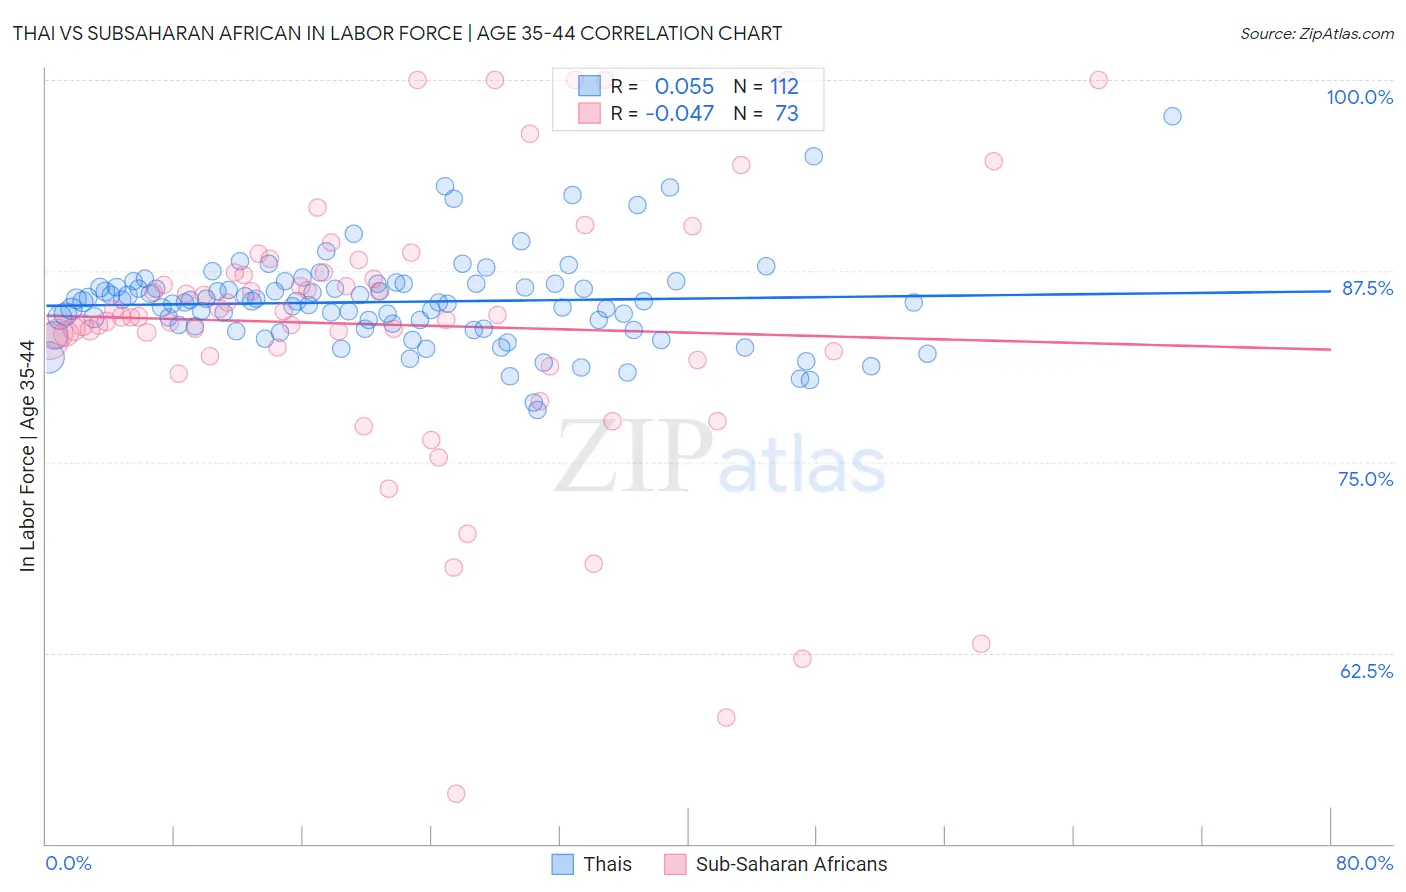
Thai vs Subsaharan African In Labor Force | Age 35-44 Correlation Chart
The statistical analysis conducted on geographies consisting of 475,470,892 people shows a slight positive correlation between the proportion of Thais and labor force participation rate among population between the ages 35 and 44 in the United States with a correlation coefficient (R) of 0.055 and weighted average of 85.2%. Similarly, the statistical analysis conducted on geographies consisting of 507,706,438 people shows no correlation between the proportion of Sub-Saharan Africans and labor force participation rate among population between the ages 35 and 44 in the United States with a correlation coefficient (R) of -0.047 and weighted average of 84.1%, a difference of 1.3%.
In Labor Force | Age 35-44 Correlation Summary
| Measurement | Thai | Subsaharan African |
| Minimum | 78.4% | 53.3% |
| Maximum | 97.6% | 100.0% |
| Range | 19.2% | 46.7% |
| Mean | 85.5% | 84.0% |
| Median | 85.5% | 84.5% |
| Interquartile 25% (IQ1) | 83.8% | 82.1% |
| Interquartile 75% (IQ3) | 86.5% | 87.4% |
| Interquartile Range (IQR) | 2.7% | 5.3% |
| Standard Deviation (Sample) | 3.0% | 9.1% |
| Standard Deviation (Population) | 3.0% | 9.0% |
Similar Demographics by In Labor Force | Age 35-44
Demographics Similar to Thais by In Labor Force | Age 35-44
In terms of in labor force | age 35-44, the demographic groups most similar to Thais are Immigrants from Albania (85.1%, a difference of 0.0%), Immigrants from Eritrea (85.2%, a difference of 0.030%), Croatian (85.2%, a difference of 0.030%), German Russian (85.2%, a difference of 0.040%), and Immigrants from Kenya (85.1%, a difference of 0.040%).
| Demographics | Rating | Rank | In Labor Force | Age 35-44 |
| Poles | 99.8 /100 | #43 | Exceptional 85.2% |
| Lithuanians | 99.8 /100 | #44 | Exceptional 85.2% |
| Cypriots | 99.8 /100 | #45 | Exceptional 85.2% |
| Immigrants | Hong Kong | 99.8 /100 | #46 | Exceptional 85.2% |
| German Russians | 99.8 /100 | #47 | Exceptional 85.2% |
| Immigrants | Eritrea | 99.7 /100 | #48 | Exceptional 85.2% |
| Croatians | 99.7 /100 | #49 | Exceptional 85.2% |
| Thais | 99.7 /100 | #50 | Exceptional 85.2% |
| Immigrants | Albania | 99.7 /100 | #51 | Exceptional 85.1% |
| Immigrants | Kenya | 99.6 /100 | #52 | Exceptional 85.1% |
| Taiwanese | 99.6 /100 | #53 | Exceptional 85.1% |
| Turks | 99.5 /100 | #54 | Exceptional 85.1% |
| Soviet Union | 99.5 /100 | #55 | Exceptional 85.1% |
| Immigrants | Croatia | 99.5 /100 | #56 | Exceptional 85.1% |
| Chinese | 99.4 /100 | #57 | Exceptional 85.1% |
Demographics Similar to Sub-Saharan Africans by In Labor Force | Age 35-44
In terms of in labor force | age 35-44, the demographic groups most similar to Sub-Saharan Africans are Immigrants from Nicaragua (84.1%, a difference of 0.0%), Immigrants from Norway (84.1%, a difference of 0.040%), French (84.0%, a difference of 0.040%), European (84.1%, a difference of 0.050%), and Nicaraguan (84.1%, a difference of 0.050%).
| Demographics | Rating | Rank | In Labor Force | Age 35-44 |
| Israelis | 14.0 /100 | #212 | Poor 84.1% |
| Bangladeshis | 13.7 /100 | #213 | Poor 84.1% |
| Immigrants | Barbados | 13.2 /100 | #214 | Poor 84.1% |
| Europeans | 12.2 /100 | #215 | Poor 84.1% |
| Nicaraguans | 12.1 /100 | #216 | Poor 84.1% |
| Immigrants | Norway | 11.7 /100 | #217 | Poor 84.1% |
| Immigrants | Nicaragua | 9.4 /100 | #218 | Tragic 84.1% |
| Sub-Saharan Africans | 9.3 /100 | #219 | Tragic 84.1% |
| French | 7.5 /100 | #220 | Tragic 84.0% |
| Icelanders | 6.7 /100 | #221 | Tragic 84.0% |
| Assyrians/Chaldeans/Syriacs | 6.6 /100 | #222 | Tragic 84.0% |
| Immigrants | Panama | 6.4 /100 | #223 | Tragic 84.0% |
| U.S. Virgin Islanders | 6.1 /100 | #224 | Tragic 84.0% |
| Immigrants | Burma/Myanmar | 6.1 /100 | #225 | Tragic 84.0% |
| Panamanians | 5.4 /100 | #226 | Tragic 84.0% |