Thai vs Slovene In Labor Force | Age 35-44
COMPARE
Thai
Slovene
In Labor Force | Age 35-44
In Labor Force | Age 35-44 Comparison
Thais
Slovenes
85.2%
IN LABOR FORCE | AGE 35-44
99.7/ 100
METRIC RATING
50th/ 347
METRIC RANK
85.6%
IN LABOR FORCE | AGE 35-44
100.0/ 100
METRIC RATING
19th/ 347
METRIC RANK
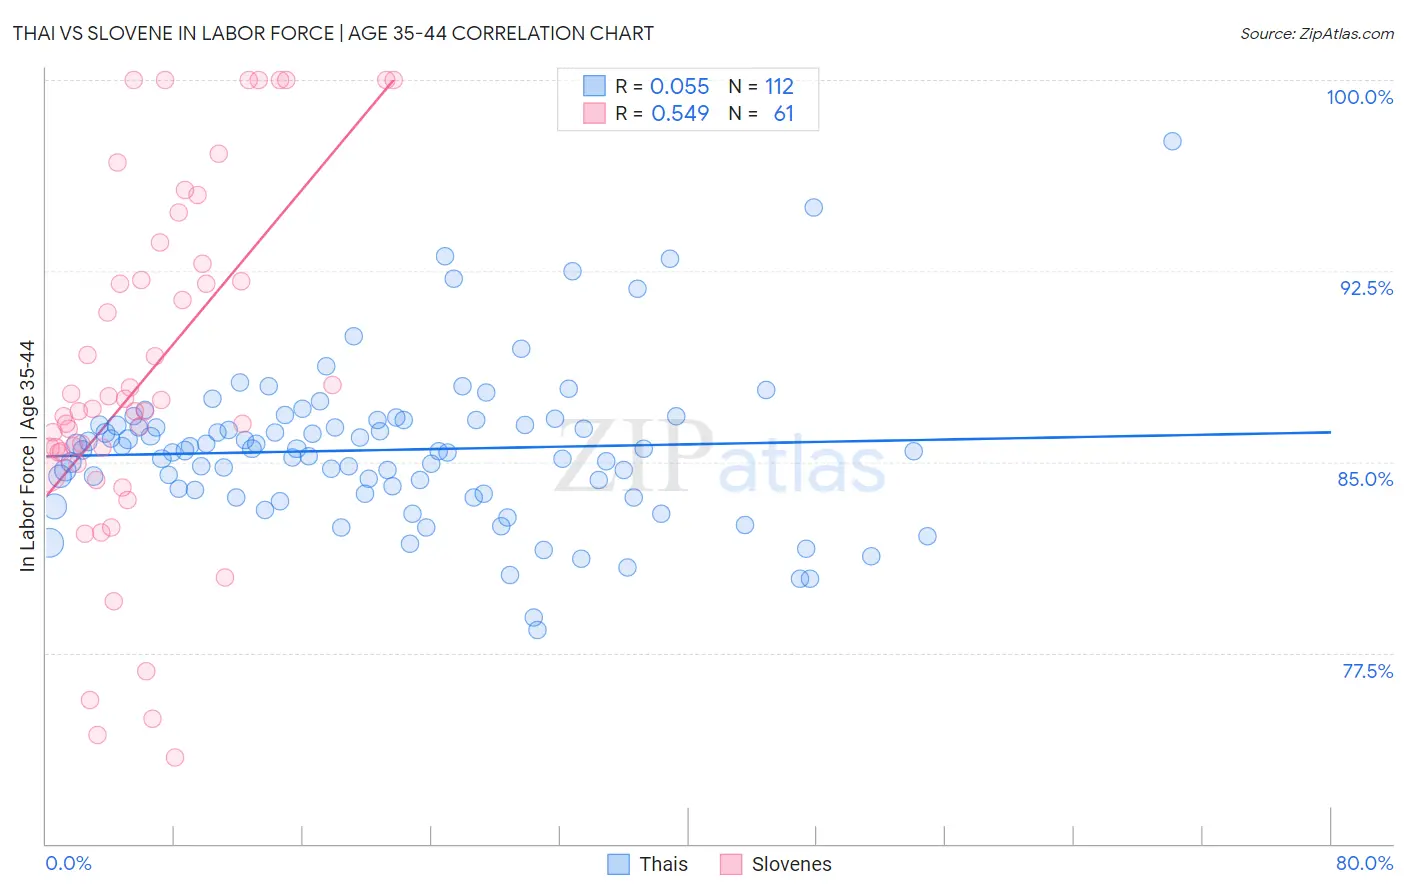
Thai vs Slovene In Labor Force | Age 35-44 Correlation Chart
The statistical analysis conducted on geographies consisting of 475,470,892 people shows a slight positive correlation between the proportion of Thais and labor force participation rate among population between the ages 35 and 44 in the United States with a correlation coefficient (R) of 0.055 and weighted average of 85.2%. Similarly, the statistical analysis conducted on geographies consisting of 261,289,238 people shows a substantial positive correlation between the proportion of Slovenes and labor force participation rate among population between the ages 35 and 44 in the United States with a correlation coefficient (R) of 0.549 and weighted average of 85.6%, a difference of 0.48%.
In Labor Force | Age 35-44 Correlation Summary
| Measurement | Thai | Slovene |
| Minimum | 78.4% | 73.4% |
| Maximum | 97.6% | 100.0% |
| Range | 19.2% | 26.6% |
| Mean | 85.5% | 88.4% |
| Median | 85.5% | 87.0% |
| Interquartile 25% (IQ1) | 83.8% | 85.1% |
| Interquartile 75% (IQ3) | 86.5% | 92.5% |
| Interquartile Range (IQR) | 2.7% | 7.3% |
| Standard Deviation (Sample) | 3.0% | 6.9% |
| Standard Deviation (Population) | 3.0% | 6.8% |
Similar Demographics by In Labor Force | Age 35-44
Demographics Similar to Thais by In Labor Force | Age 35-44
In terms of in labor force | age 35-44, the demographic groups most similar to Thais are Immigrants from Albania (85.1%, a difference of 0.0%), Immigrants from Eritrea (85.2%, a difference of 0.030%), Croatian (85.2%, a difference of 0.030%), German Russian (85.2%, a difference of 0.040%), and Immigrants from Kenya (85.1%, a difference of 0.040%).
| Demographics | Rating | Rank | In Labor Force | Age 35-44 |
| Poles | 99.8 /100 | #43 | Exceptional 85.2% |
| Lithuanians | 99.8 /100 | #44 | Exceptional 85.2% |
| Cypriots | 99.8 /100 | #45 | Exceptional 85.2% |
| Immigrants | Hong Kong | 99.8 /100 | #46 | Exceptional 85.2% |
| German Russians | 99.8 /100 | #47 | Exceptional 85.2% |
| Immigrants | Eritrea | 99.7 /100 | #48 | Exceptional 85.2% |
| Croatians | 99.7 /100 | #49 | Exceptional 85.2% |
| Thais | 99.7 /100 | #50 | Exceptional 85.2% |
| Immigrants | Albania | 99.7 /100 | #51 | Exceptional 85.1% |
| Immigrants | Kenya | 99.6 /100 | #52 | Exceptional 85.1% |
| Taiwanese | 99.6 /100 | #53 | Exceptional 85.1% |
| Turks | 99.5 /100 | #54 | Exceptional 85.1% |
| Soviet Union | 99.5 /100 | #55 | Exceptional 85.1% |
| Immigrants | Croatia | 99.5 /100 | #56 | Exceptional 85.1% |
| Chinese | 99.4 /100 | #57 | Exceptional 85.1% |
Demographics Similar to Slovenes by In Labor Force | Age 35-44
In terms of in labor force | age 35-44, the demographic groups most similar to Slovenes are Immigrants from North Macedonia (85.6%, a difference of 0.0%), Carpatho Rusyn (85.6%, a difference of 0.0%), Immigrants from Serbia (85.5%, a difference of 0.040%), Norwegian (85.6%, a difference of 0.050%), and Immigrants from Ireland (85.6%, a difference of 0.050%).
| Demographics | Rating | Rank | In Labor Force | Age 35-44 |
| Liberians | 100.0 /100 | #12 | Exceptional 85.7% |
| Somalis | 100.0 /100 | #13 | Exceptional 85.6% |
| Immigrants | Somalia | 100.0 /100 | #14 | Exceptional 85.6% |
| Norwegians | 100.0 /100 | #15 | Exceptional 85.6% |
| Immigrants | Ireland | 100.0 /100 | #16 | Exceptional 85.6% |
| Immigrants | North Macedonia | 100.0 /100 | #17 | Exceptional 85.6% |
| Carpatho Rusyns | 100.0 /100 | #18 | Exceptional 85.6% |
| Slovenes | 100.0 /100 | #19 | Exceptional 85.6% |
| Immigrants | Serbia | 100.0 /100 | #20 | Exceptional 85.5% |
| Bulgarians | 100.0 /100 | #21 | Exceptional 85.5% |
| Immigrants | Bosnia and Herzegovina | 100.0 /100 | #22 | Exceptional 85.4% |
| Immigrants | Eastern Africa | 100.0 /100 | #23 | Exceptional 85.4% |
| Latvians | 99.9 /100 | #24 | Exceptional 85.4% |
| Paraguayans | 99.9 /100 | #25 | Exceptional 85.4% |
| Immigrants | Liberia | 99.9 /100 | #26 | Exceptional 85.4% |