Thai vs Subsaharan African No Schooling Completed
COMPARE
Thai
Subsaharan African
No Schooling Completed
No Schooling Completed Comparison
Thais
Sub-Saharan Africans
1.8%
NO SCHOOLING COMPLETED
97.5/ 100
METRIC RATING
104th/ 347
METRIC RANK
2.3%
NO SCHOOLING COMPLETED
4.7/ 100
METRIC RATING
222nd/ 347
METRIC RANK
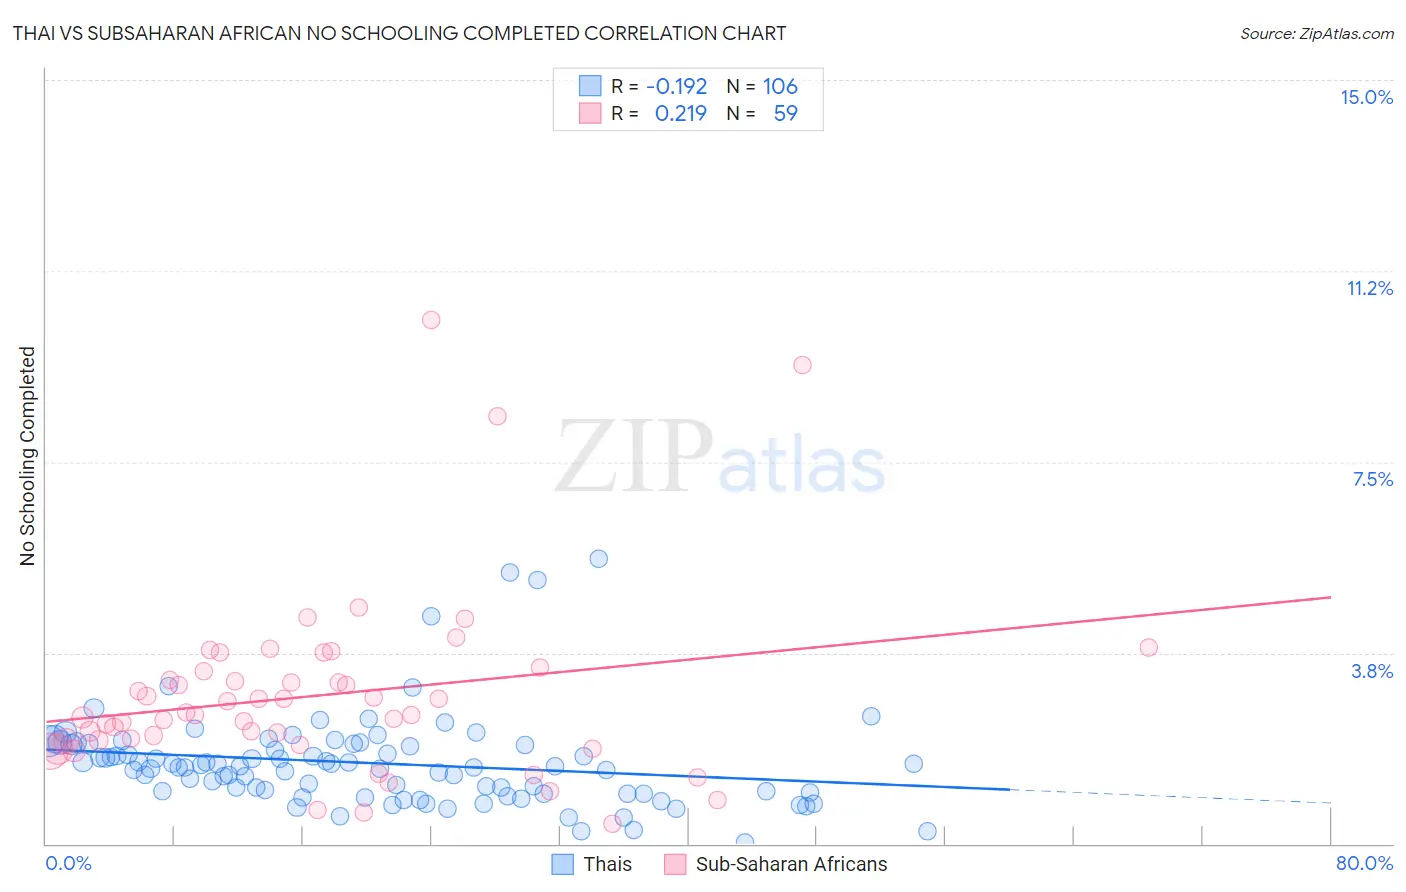
Thai vs Subsaharan African No Schooling Completed Correlation Chart
The statistical analysis conducted on geographies consisting of 469,412,663 people shows a poor negative correlation between the proportion of Thais and percentage of population with no schooling in the United States with a correlation coefficient (R) of -0.192 and weighted average of 1.8%. Similarly, the statistical analysis conducted on geographies consisting of 500,622,971 people shows a weak positive correlation between the proportion of Sub-Saharan Africans and percentage of population with no schooling in the United States with a correlation coefficient (R) of 0.219 and weighted average of 2.3%, a difference of 25.6%.
No Schooling Completed Correlation Summary
| Measurement | Thai | Subsaharan African |
| Minimum | 0.015% | 0.39% |
| Maximum | 5.6% | 10.3% |
| Range | 5.6% | 9.9% |
| Mean | 1.6% | 2.9% |
| Median | 1.5% | 2.5% |
| Interquartile 25% (IQ1) | 1.0% | 2.0% |
| Interquartile 75% (IQ3) | 2.0% | 3.4% |
| Interquartile Range (IQR) | 0.95% | 1.4% |
| Standard Deviation (Sample) | 0.92% | 1.8% |
| Standard Deviation (Population) | 0.92% | 1.8% |
Similar Demographics by No Schooling Completed
Demographics Similar to Thais by No Schooling Completed
In terms of no schooling completed, the demographic groups most similar to Thais are German Russian (1.8%, a difference of 0.020%), Immigrants from France (1.8%, a difference of 0.42%), Yugoslavian (1.8%, a difference of 0.46%), Basque (1.8%, a difference of 0.57%), and Immigrants from Czechoslovakia (1.8%, a difference of 0.63%).
| Demographics | Rating | Rank | No Schooling Completed |
| Immigrants | Ireland | 98.4 /100 | #97 | Exceptional 1.8% |
| Iranians | 98.2 /100 | #98 | Exceptional 1.8% |
| Choctaw | 98.1 /100 | #99 | Exceptional 1.8% |
| Immigrants | Singapore | 98.0 /100 | #100 | Exceptional 1.8% |
| Immigrants | Czechoslovakia | 97.9 /100 | #101 | Exceptional 1.8% |
| Immigrants | Switzerland | 97.9 /100 | #102 | Exceptional 1.8% |
| Basques | 97.9 /100 | #103 | Exceptional 1.8% |
| Thais | 97.5 /100 | #104 | Exceptional 1.8% |
| German Russians | 97.5 /100 | #105 | Exceptional 1.8% |
| Immigrants | France | 97.3 /100 | #106 | Exceptional 1.8% |
| Yugoslavians | 97.2 /100 | #107 | Exceptional 1.8% |
| Okinawans | 97.1 /100 | #108 | Exceptional 1.8% |
| Immigrants | Saudi Arabia | 96.8 /100 | #109 | Exceptional 1.9% |
| Immigrants | Latvia | 96.7 /100 | #110 | Exceptional 1.9% |
| Immigrants | Japan | 96.6 /100 | #111 | Exceptional 1.9% |
Demographics Similar to Sub-Saharan Africans by No Schooling Completed
In terms of no schooling completed, the demographic groups most similar to Sub-Saharan Africans are Immigrants from Lebanon (2.3%, a difference of 0.15%), Immigrants from Sudan (2.3%, a difference of 0.17%), Immigrants from Costa Rica (2.3%, a difference of 0.26%), Tohono O'odham (2.3%, a difference of 0.44%), and Sudanese (2.3%, a difference of 0.44%).
| Demographics | Rating | Rank | No Schooling Completed |
| Immigrants | Zaire | 7.2 /100 | #215 | Tragic 2.3% |
| Tongans | 6.8 /100 | #216 | Tragic 2.3% |
| Immigrants | Syria | 6.6 /100 | #217 | Tragic 2.3% |
| Immigrants | Nepal | 6.4 /100 | #218 | Tragic 2.3% |
| Senegalese | 5.6 /100 | #219 | Tragic 2.3% |
| Immigrants | Costa Rica | 5.1 /100 | #220 | Tragic 2.3% |
| Immigrants | Sudan | 5.0 /100 | #221 | Tragic 2.3% |
| Sub-Saharan Africans | 4.7 /100 | #222 | Tragic 2.3% |
| Immigrants | Lebanon | 4.5 /100 | #223 | Tragic 2.3% |
| Tohono O'odham | 4.1 /100 | #224 | Tragic 2.3% |
| Sudanese | 4.1 /100 | #225 | Tragic 2.3% |
| Sierra Leoneans | 4.1 /100 | #226 | Tragic 2.3% |
| Immigrants | Uganda | 4.0 /100 | #227 | Tragic 2.3% |
| U.S. Virgin Islanders | 3.7 /100 | #228 | Tragic 2.3% |
| Immigrants | Pakistan | 3.6 /100 | #229 | Tragic 2.3% |