Aleut vs Subsaharan African In Labor Force | Age 35-44
COMPARE
Aleut
Subsaharan African
In Labor Force | Age 35-44
In Labor Force | Age 35-44 Comparison
Aleuts
Sub-Saharan Africans
84.4%
IN LABOR FORCE | AGE 35-44
59.1/ 100
METRIC RATING
163rd/ 347
METRIC RANK
84.1%
IN LABOR FORCE | AGE 35-44
9.3/ 100
METRIC RATING
219th/ 347
METRIC RANK
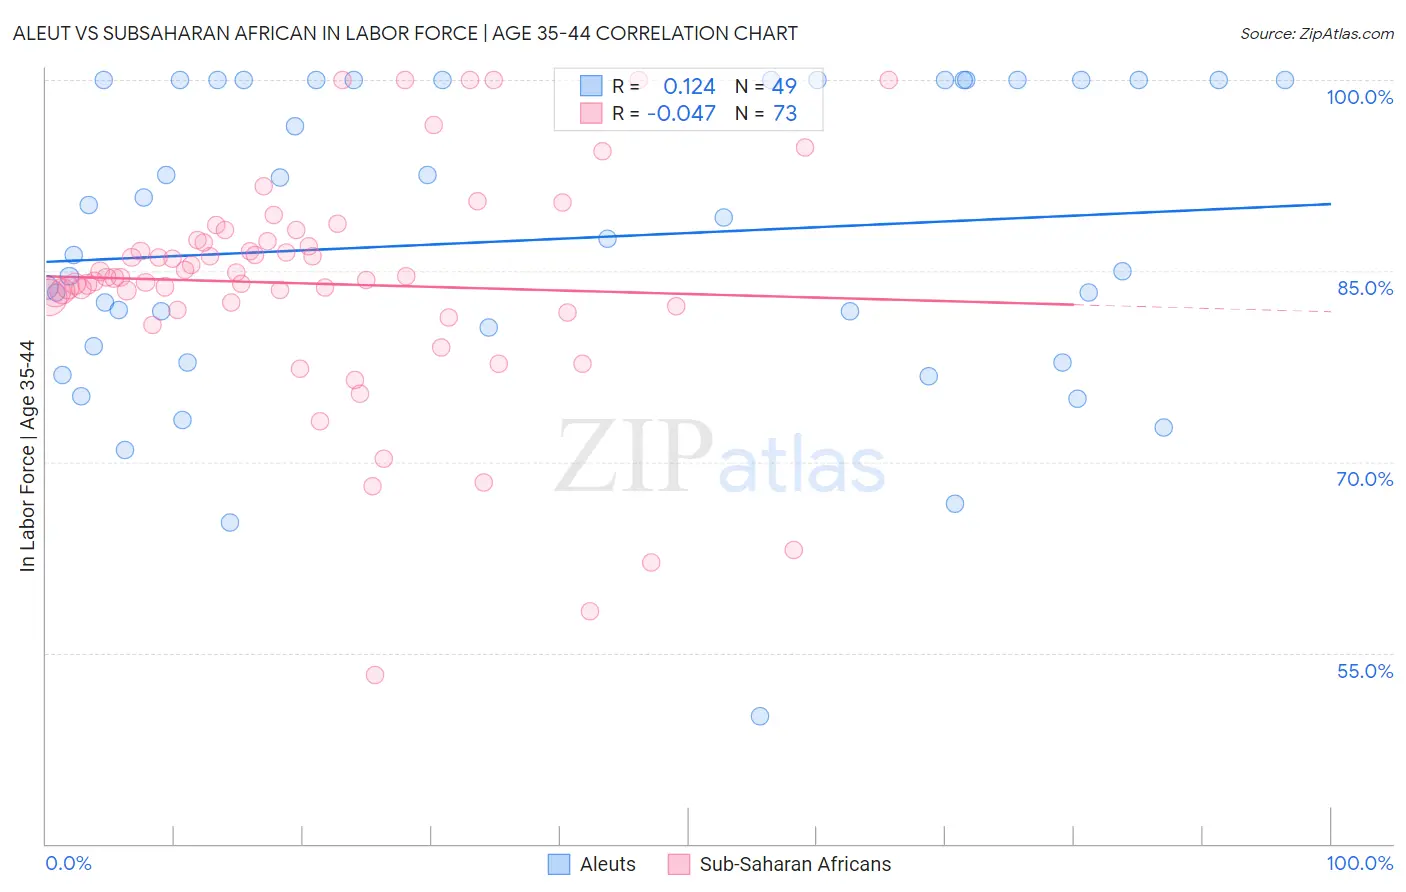
Aleut vs Subsaharan African In Labor Force | Age 35-44 Correlation Chart
The statistical analysis conducted on geographies consisting of 61,775,675 people shows a poor positive correlation between the proportion of Aleuts and labor force participation rate among population between the ages 35 and 44 in the United States with a correlation coefficient (R) of 0.124 and weighted average of 84.4%. Similarly, the statistical analysis conducted on geographies consisting of 507,706,438 people shows no correlation between the proportion of Sub-Saharan Africans and labor force participation rate among population between the ages 35 and 44 in the United States with a correlation coefficient (R) of -0.047 and weighted average of 84.1%, a difference of 0.43%.
In Labor Force | Age 35-44 Correlation Summary
| Measurement | Aleut | Subsaharan African |
| Minimum | 50.0% | 53.3% |
| Maximum | 100.0% | 100.0% |
| Range | 50.0% | 46.7% |
| Mean | 87.4% | 84.0% |
| Median | 87.5% | 84.5% |
| Interquartile 25% (IQ1) | 78.4% | 82.1% |
| Interquartile 75% (IQ3) | 100.0% | 87.4% |
| Interquartile Range (IQR) | 21.6% | 5.3% |
| Standard Deviation (Sample) | 12.0% | 9.1% |
| Standard Deviation (Population) | 11.9% | 9.0% |
Similar Demographics by In Labor Force | Age 35-44
Demographics Similar to Aleuts by In Labor Force | Age 35-44
In terms of in labor force | age 35-44, the demographic groups most similar to Aleuts are Immigrants from Hungary (84.4%, a difference of 0.0%), Nigerian (84.4%, a difference of 0.0%), Immigrants from Senegal (84.4%, a difference of 0.010%), Immigrants from Kazakhstan (84.4%, a difference of 0.010%), and Immigrants from Venezuela (84.4%, a difference of 0.010%).
| Demographics | Rating | Rank | In Labor Force | Age 35-44 |
| Immigrants | Israel | 64.3 /100 | #156 | Good 84.4% |
| Immigrants | Austria | 63.8 /100 | #157 | Good 84.4% |
| Jamaicans | 62.7 /100 | #158 | Good 84.4% |
| Immigrants | Senegal | 60.4 /100 | #159 | Good 84.4% |
| Immigrants | Kazakhstan | 60.4 /100 | #160 | Good 84.4% |
| Immigrants | Venezuela | 60.0 /100 | #161 | Good 84.4% |
| Immigrants | Hungary | 59.4 /100 | #162 | Average 84.4% |
| Aleuts | 59.1 /100 | #163 | Average 84.4% |
| Nigerians | 58.9 /100 | #164 | Average 84.4% |
| Venezuelans | 58.1 /100 | #165 | Average 84.4% |
| Alsatians | 55.2 /100 | #166 | Average 84.4% |
| Immigrants | Portugal | 55.2 /100 | #167 | Average 84.4% |
| Irish | 53.1 /100 | #168 | Average 84.4% |
| Immigrants | Afghanistan | 52.7 /100 | #169 | Average 84.4% |
| Immigrants | Jordan | 52.5 /100 | #170 | Average 84.4% |
Demographics Similar to Sub-Saharan Africans by In Labor Force | Age 35-44
In terms of in labor force | age 35-44, the demographic groups most similar to Sub-Saharan Africans are Immigrants from Nicaragua (84.1%, a difference of 0.0%), Immigrants from Norway (84.1%, a difference of 0.040%), French (84.0%, a difference of 0.040%), European (84.1%, a difference of 0.050%), and Nicaraguan (84.1%, a difference of 0.050%).
| Demographics | Rating | Rank | In Labor Force | Age 35-44 |
| Israelis | 14.0 /100 | #212 | Poor 84.1% |
| Bangladeshis | 13.7 /100 | #213 | Poor 84.1% |
| Immigrants | Barbados | 13.2 /100 | #214 | Poor 84.1% |
| Europeans | 12.2 /100 | #215 | Poor 84.1% |
| Nicaraguans | 12.1 /100 | #216 | Poor 84.1% |
| Immigrants | Norway | 11.7 /100 | #217 | Poor 84.1% |
| Immigrants | Nicaragua | 9.4 /100 | #218 | Tragic 84.1% |
| Sub-Saharan Africans | 9.3 /100 | #219 | Tragic 84.1% |
| French | 7.5 /100 | #220 | Tragic 84.0% |
| Icelanders | 6.7 /100 | #221 | Tragic 84.0% |
| Assyrians/Chaldeans/Syriacs | 6.6 /100 | #222 | Tragic 84.0% |
| Immigrants | Panama | 6.4 /100 | #223 | Tragic 84.0% |
| U.S. Virgin Islanders | 6.1 /100 | #224 | Tragic 84.0% |
| Immigrants | Burma/Myanmar | 6.1 /100 | #225 | Tragic 84.0% |
| Panamanians | 5.4 /100 | #226 | Tragic 84.0% |