Thai vs Immigrants In Labor Force | Age 35-44
COMPARE
Thai
Immigrants
In Labor Force | Age 35-44
In Labor Force | Age 35-44 Comparison
Thais
Immigrants
85.2%
IN LABOR FORCE | AGE 35-44
99.7/ 100
METRIC RATING
50th/ 347
METRIC RANK
83.7%
IN LABOR FORCE | AGE 35-44
1.0/ 100
METRIC RATING
246th/ 347
METRIC RANK
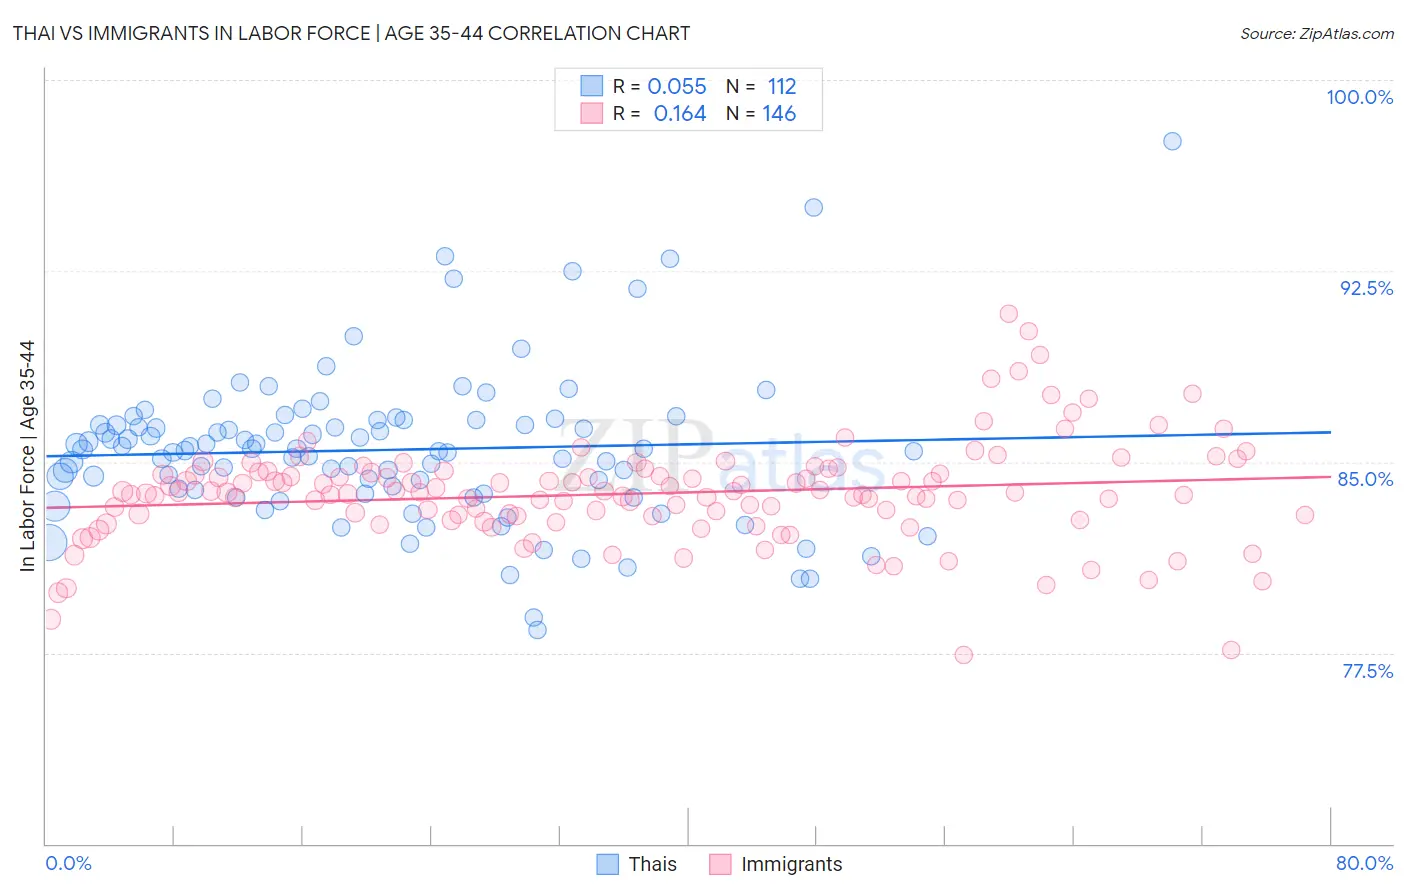
Thai vs Immigrants In Labor Force | Age 35-44 Correlation Chart
The statistical analysis conducted on geographies consisting of 475,470,892 people shows a slight positive correlation between the proportion of Thais and labor force participation rate among population between the ages 35 and 44 in the United States with a correlation coefficient (R) of 0.055 and weighted average of 85.2%. Similarly, the statistical analysis conducted on geographies consisting of 576,964,624 people shows a poor positive correlation between the proportion of Immigrants and labor force participation rate among population between the ages 35 and 44 in the United States with a correlation coefficient (R) of 0.164 and weighted average of 83.7%, a difference of 1.7%.
In Labor Force | Age 35-44 Correlation Summary
| Measurement | Thai | Immigrants |
| Minimum | 78.4% | 77.4% |
| Maximum | 97.6% | 90.8% |
| Range | 19.2% | 13.4% |
| Mean | 85.5% | 83.8% |
| Median | 85.5% | 83.8% |
| Interquartile 25% (IQ1) | 83.8% | 82.9% |
| Interquartile 75% (IQ3) | 86.5% | 84.6% |
| Interquartile Range (IQR) | 2.7% | 1.7% |
| Standard Deviation (Sample) | 3.0% | 2.0% |
| Standard Deviation (Population) | 3.0% | 2.0% |
Similar Demographics by In Labor Force | Age 35-44
Demographics Similar to Thais by In Labor Force | Age 35-44
In terms of in labor force | age 35-44, the demographic groups most similar to Thais are Immigrants from Albania (85.1%, a difference of 0.0%), Immigrants from Eritrea (85.2%, a difference of 0.030%), Croatian (85.2%, a difference of 0.030%), German Russian (85.2%, a difference of 0.040%), and Immigrants from Kenya (85.1%, a difference of 0.040%).
| Demographics | Rating | Rank | In Labor Force | Age 35-44 |
| Poles | 99.8 /100 | #43 | Exceptional 85.2% |
| Lithuanians | 99.8 /100 | #44 | Exceptional 85.2% |
| Cypriots | 99.8 /100 | #45 | Exceptional 85.2% |
| Immigrants | Hong Kong | 99.8 /100 | #46 | Exceptional 85.2% |
| German Russians | 99.8 /100 | #47 | Exceptional 85.2% |
| Immigrants | Eritrea | 99.7 /100 | #48 | Exceptional 85.2% |
| Croatians | 99.7 /100 | #49 | Exceptional 85.2% |
| Thais | 99.7 /100 | #50 | Exceptional 85.2% |
| Immigrants | Albania | 99.7 /100 | #51 | Exceptional 85.1% |
| Immigrants | Kenya | 99.6 /100 | #52 | Exceptional 85.1% |
| Taiwanese | 99.6 /100 | #53 | Exceptional 85.1% |
| Turks | 99.5 /100 | #54 | Exceptional 85.1% |
| Soviet Union | 99.5 /100 | #55 | Exceptional 85.1% |
| Immigrants | Croatia | 99.5 /100 | #56 | Exceptional 85.1% |
| Chinese | 99.4 /100 | #57 | Exceptional 85.1% |
Demographics Similar to Immigrants by In Labor Force | Age 35-44
In terms of in labor force | age 35-44, the demographic groups most similar to Immigrants are Guyanese (83.8%, a difference of 0.010%), Malaysian (83.8%, a difference of 0.010%), Immigrants from Cambodia (83.8%, a difference of 0.020%), Immigrants from Western Asia (83.8%, a difference of 0.020%), and Immigrants from Armenia (83.7%, a difference of 0.020%).
| Demographics | Rating | Rank | In Labor Force | Age 35-44 |
| Celtics | 1.4 /100 | #239 | Tragic 83.8% |
| Arabs | 1.3 /100 | #240 | Tragic 83.8% |
| Iraqis | 1.3 /100 | #241 | Tragic 83.8% |
| Immigrants | Cambodia | 1.1 /100 | #242 | Tragic 83.8% |
| Immigrants | Western Asia | 1.1 /100 | #243 | Tragic 83.8% |
| Guyanese | 1.1 /100 | #244 | Tragic 83.8% |
| Malaysians | 1.1 /100 | #245 | Tragic 83.8% |
| Immigrants | Immigrants | 1.0 /100 | #246 | Tragic 83.7% |
| Immigrants | Armenia | 0.9 /100 | #247 | Tragic 83.7% |
| Indonesians | 0.8 /100 | #248 | Tragic 83.7% |
| Immigrants | St. Vincent and the Grenadines | 0.7 /100 | #249 | Tragic 83.7% |
| Whites/Caucasians | 0.5 /100 | #250 | Tragic 83.6% |
| Salvadorans | 0.4 /100 | #251 | Tragic 83.6% |
| Immigrants | Guyana | 0.4 /100 | #252 | Tragic 83.6% |
| Lebanese | 0.4 /100 | #253 | Tragic 83.6% |