Immigrants from Jamaica vs Subsaharan African In Labor Force | Age 35-44
COMPARE
Immigrants from Jamaica
Subsaharan African
In Labor Force | Age 35-44
In Labor Force | Age 35-44 Comparison
Immigrants from Jamaica
Sub-Saharan Africans
84.6%
IN LABOR FORCE | AGE 35-44
79.4/ 100
METRIC RATING
144th/ 347
METRIC RANK
84.1%
IN LABOR FORCE | AGE 35-44
9.3/ 100
METRIC RATING
219th/ 347
METRIC RANK
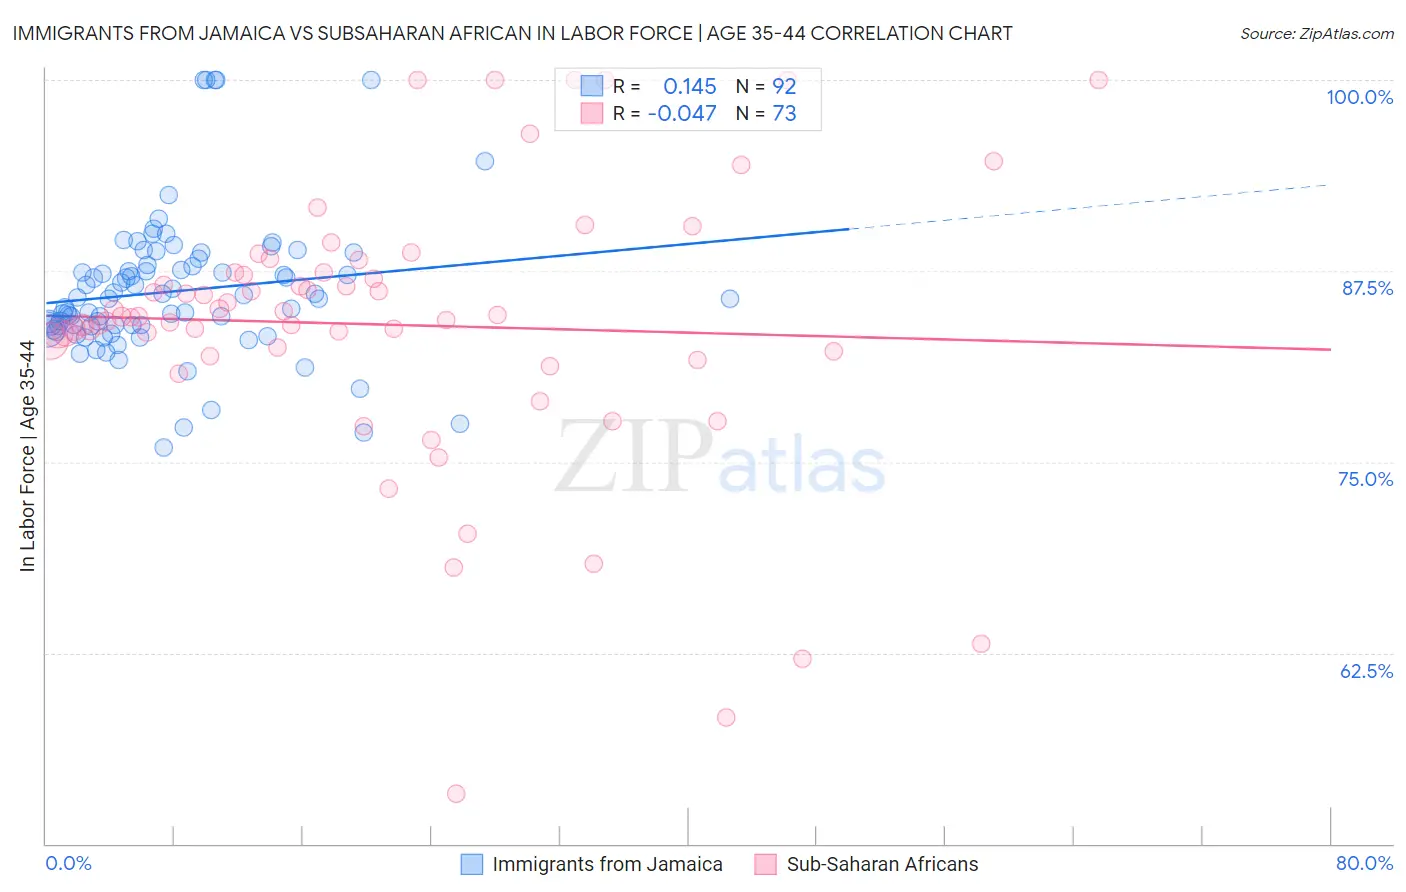
Immigrants from Jamaica vs Subsaharan African In Labor Force | Age 35-44 Correlation Chart
The statistical analysis conducted on geographies consisting of 301,667,003 people shows a poor positive correlation between the proportion of Immigrants from Jamaica and labor force participation rate among population between the ages 35 and 44 in the United States with a correlation coefficient (R) of 0.145 and weighted average of 84.6%. Similarly, the statistical analysis conducted on geographies consisting of 507,706,438 people shows no correlation between the proportion of Sub-Saharan Africans and labor force participation rate among population between the ages 35 and 44 in the United States with a correlation coefficient (R) of -0.047 and weighted average of 84.1%, a difference of 0.59%.
In Labor Force | Age 35-44 Correlation Summary
| Measurement | Immigrants from Jamaica | Subsaharan African |
| Minimum | 75.9% | 53.3% |
| Maximum | 100.0% | 100.0% |
| Range | 24.1% | 46.7% |
| Mean | 86.2% | 84.0% |
| Median | 85.7% | 84.5% |
| Interquartile 25% (IQ1) | 83.7% | 82.1% |
| Interquartile 75% (IQ3) | 87.9% | 87.4% |
| Interquartile Range (IQR) | 4.1% | 5.3% |
| Standard Deviation (Sample) | 4.7% | 9.1% |
| Standard Deviation (Population) | 4.6% | 9.0% |
Similar Demographics by In Labor Force | Age 35-44
Demographics Similar to Immigrants from Jamaica by In Labor Force | Age 35-44
In terms of in labor force | age 35-44, the demographic groups most similar to Immigrants from Jamaica are Immigrants from Ukraine (84.6%, a difference of 0.0%), Immigrants from Saudi Arabia (84.6%, a difference of 0.0%), Immigrants from Belgium (84.6%, a difference of 0.010%), Immigrants from Uruguay (84.6%, a difference of 0.010%), and Immigrants from Asia (84.5%, a difference of 0.010%).
| Demographics | Rating | Rank | In Labor Force | Age 35-44 |
| Immigrants | Chile | 84.6 /100 | #137 | Excellent 84.6% |
| Czechoslovakians | 82.6 /100 | #138 | Excellent 84.6% |
| Immigrants | Zaire | 82.5 /100 | #139 | Excellent 84.6% |
| Immigrants | Japan | 81.4 /100 | #140 | Excellent 84.6% |
| Immigrants | Belgium | 80.8 /100 | #141 | Excellent 84.6% |
| Immigrants | Uruguay | 80.1 /100 | #142 | Excellent 84.6% |
| Immigrants | Ukraine | 79.7 /100 | #143 | Good 84.6% |
| Immigrants | Jamaica | 79.4 /100 | #144 | Good 84.6% |
| Immigrants | Saudi Arabia | 79.4 /100 | #145 | Good 84.6% |
| Immigrants | Asia | 78.7 /100 | #146 | Good 84.5% |
| Immigrants | Netherlands | 76.6 /100 | #147 | Good 84.5% |
| South American Indians | 73.6 /100 | #148 | Good 84.5% |
| Okinawans | 73.5 /100 | #149 | Good 84.5% |
| Immigrants | Nigeria | 73.3 /100 | #150 | Good 84.5% |
| Romanians | 72.1 /100 | #151 | Good 84.5% |
Demographics Similar to Sub-Saharan Africans by In Labor Force | Age 35-44
In terms of in labor force | age 35-44, the demographic groups most similar to Sub-Saharan Africans are Immigrants from Nicaragua (84.1%, a difference of 0.0%), Immigrants from Norway (84.1%, a difference of 0.040%), French (84.0%, a difference of 0.040%), European (84.1%, a difference of 0.050%), and Nicaraguan (84.1%, a difference of 0.050%).
| Demographics | Rating | Rank | In Labor Force | Age 35-44 |
| Israelis | 14.0 /100 | #212 | Poor 84.1% |
| Bangladeshis | 13.7 /100 | #213 | Poor 84.1% |
| Immigrants | Barbados | 13.2 /100 | #214 | Poor 84.1% |
| Europeans | 12.2 /100 | #215 | Poor 84.1% |
| Nicaraguans | 12.1 /100 | #216 | Poor 84.1% |
| Immigrants | Norway | 11.7 /100 | #217 | Poor 84.1% |
| Immigrants | Nicaragua | 9.4 /100 | #218 | Tragic 84.1% |
| Sub-Saharan Africans | 9.3 /100 | #219 | Tragic 84.1% |
| French | 7.5 /100 | #220 | Tragic 84.0% |
| Icelanders | 6.7 /100 | #221 | Tragic 84.0% |
| Assyrians/Chaldeans/Syriacs | 6.6 /100 | #222 | Tragic 84.0% |
| Immigrants | Panama | 6.4 /100 | #223 | Tragic 84.0% |
| U.S. Virgin Islanders | 6.1 /100 | #224 | Tragic 84.0% |
| Immigrants | Burma/Myanmar | 6.1 /100 | #225 | Tragic 84.0% |
| Panamanians | 5.4 /100 | #226 | Tragic 84.0% |