Swiss vs Immigrants from Grenada In Labor Force | Age 25-29
COMPARE
Swiss
Immigrants from Grenada
In Labor Force | Age 25-29
In Labor Force | Age 25-29 Comparison
Swiss
Immigrants from Grenada
84.7%
IN LABOR FORCE | AGE 25-29
64.7/ 100
METRIC RATING
150th/ 347
METRIC RANK
82.8%
IN LABOR FORCE | AGE 25-29
0.0/ 100
METRIC RATING
303rd/ 347
METRIC RANK
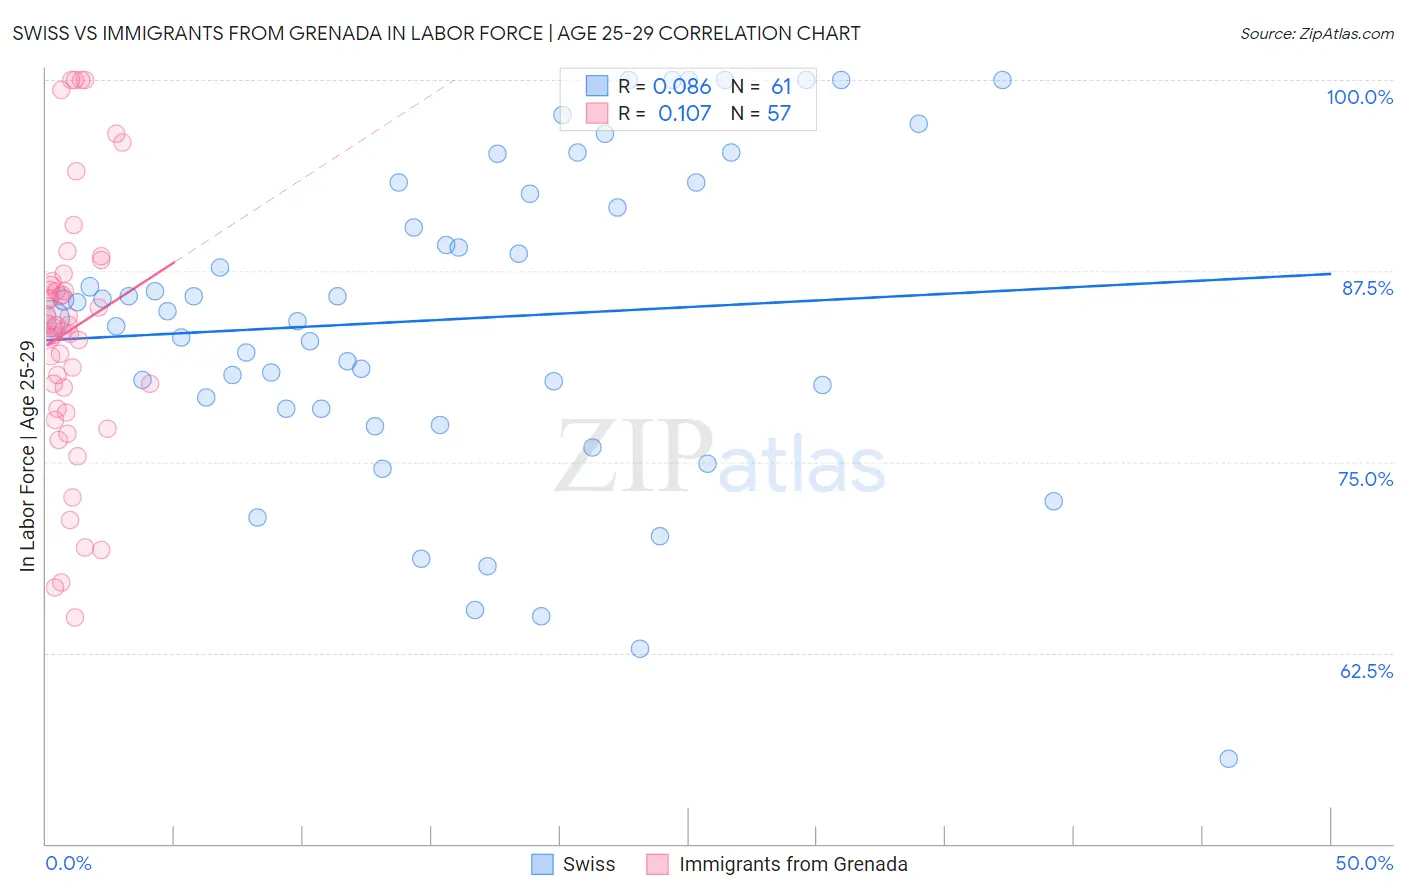
Swiss vs Immigrants from Grenada In Labor Force | Age 25-29 Correlation Chart
The statistical analysis conducted on geographies consisting of 464,613,685 people shows a slight positive correlation between the proportion of Swiss and labor force participation rate among population between the ages 25 and 29 in the United States with a correlation coefficient (R) of 0.086 and weighted average of 84.7%. Similarly, the statistical analysis conducted on geographies consisting of 67,199,109 people shows a poor positive correlation between the proportion of Immigrants from Grenada and labor force participation rate among population between the ages 25 and 29 in the United States with a correlation coefficient (R) of 0.107 and weighted average of 82.8%, a difference of 2.4%.
In Labor Force | Age 25-29 Correlation Summary
| Measurement | Swiss | Immigrants from Grenada |
| Minimum | 55.6% | 64.8% |
| Maximum | 100.0% | 100.0% |
| Range | 44.4% | 35.2% |
| Mean | 84.4% | 83.6% |
| Median | 84.8% | 84.0% |
| Interquartile 25% (IQ1) | 78.5% | 79.2% |
| Interquartile 75% (IQ3) | 92.9% | 86.7% |
| Interquartile Range (IQR) | 14.4% | 7.6% |
| Standard Deviation (Sample) | 10.5% | 8.3% |
| Standard Deviation (Population) | 10.4% | 8.3% |
Similar Demographics by In Labor Force | Age 25-29
Demographics Similar to Swiss by In Labor Force | Age 25-29
In terms of in labor force | age 25-29, the demographic groups most similar to Swiss are Immigrants from England (84.7%, a difference of 0.0%), Peruvian (84.7%, a difference of 0.0%), Colombian (84.7%, a difference of 0.010%), Immigrants from Pakistan (84.7%, a difference of 0.020%), and Immigrants from Taiwan (84.7%, a difference of 0.020%).
| Demographics | Rating | Rank | In Labor Force | Age 25-29 |
| Sri Lankans | 69.2 /100 | #143 | Good 84.8% |
| Immigrants | Laos | 69.0 /100 | #144 | Good 84.8% |
| Immigrants | Senegal | 68.3 /100 | #145 | Good 84.8% |
| Icelanders | 68.2 /100 | #146 | Good 84.8% |
| Immigrants | Asia | 68.2 /100 | #147 | Good 84.8% |
| Immigrants | England | 65.2 /100 | #148 | Good 84.7% |
| Peruvians | 64.7 /100 | #149 | Good 84.7% |
| Swiss | 64.7 /100 | #150 | Good 84.7% |
| Colombians | 62.8 /100 | #151 | Good 84.7% |
| Immigrants | Pakistan | 62.7 /100 | #152 | Good 84.7% |
| Immigrants | Taiwan | 62.2 /100 | #153 | Good 84.7% |
| Immigrants | Sri Lanka | 61.7 /100 | #154 | Good 84.7% |
| Indians (Asian) | 61.6 /100 | #155 | Good 84.7% |
| French | 61.0 /100 | #156 | Good 84.7% |
| British | 60.4 /100 | #157 | Good 84.7% |
Demographics Similar to Immigrants from Grenada by In Labor Force | Age 25-29
In terms of in labor force | age 25-29, the demographic groups most similar to Immigrants from Grenada are Immigrants from Belize (82.8%, a difference of 0.010%), Vietnamese (82.8%, a difference of 0.050%), Spanish American Indian (82.9%, a difference of 0.11%), Fijian (82.9%, a difference of 0.12%), and Immigrants from St. Vincent and the Grenadines (82.7%, a difference of 0.12%).
| Demographics | Rating | Rank | In Labor Force | Age 25-29 |
| Immigrants | Nicaragua | 0.0 /100 | #296 | Tragic 82.9% |
| Potawatomi | 0.0 /100 | #297 | Tragic 82.9% |
| Native Hawaiians | 0.0 /100 | #298 | Tragic 82.9% |
| Fijians | 0.0 /100 | #299 | Tragic 82.9% |
| Spanish American Indians | 0.0 /100 | #300 | Tragic 82.9% |
| Vietnamese | 0.0 /100 | #301 | Tragic 82.8% |
| Immigrants | Belize | 0.0 /100 | #302 | Tragic 82.8% |
| Immigrants | Grenada | 0.0 /100 | #303 | Tragic 82.8% |
| Immigrants | St. Vincent and the Grenadines | 0.0 /100 | #304 | Tragic 82.7% |
| Blacks/African Americans | 0.0 /100 | #305 | Tragic 82.6% |
| Blackfeet | 0.0 /100 | #306 | Tragic 82.6% |
| Cajuns | 0.0 /100 | #307 | Tragic 82.5% |
| Central American Indians | 0.0 /100 | #308 | Tragic 82.4% |
| Immigrants | Central America | 0.0 /100 | #309 | Tragic 82.4% |
| Osage | 0.0 /100 | #310 | Tragic 82.3% |