Swedish vs Immigrants from Czechoslovakia In Labor Force | Age 30-34
COMPARE
Swedish
Immigrants from Czechoslovakia
In Labor Force | Age 30-34
In Labor Force | Age 30-34 Comparison
Swedes
Immigrants from Czechoslovakia
85.2%
IN LABOR FORCE | AGE 30-34
97.5/ 100
METRIC RATING
94th/ 347
METRIC RANK
85.4%
IN LABOR FORCE | AGE 30-34
99.0/ 100
METRIC RATING
75th/ 347
METRIC RANK
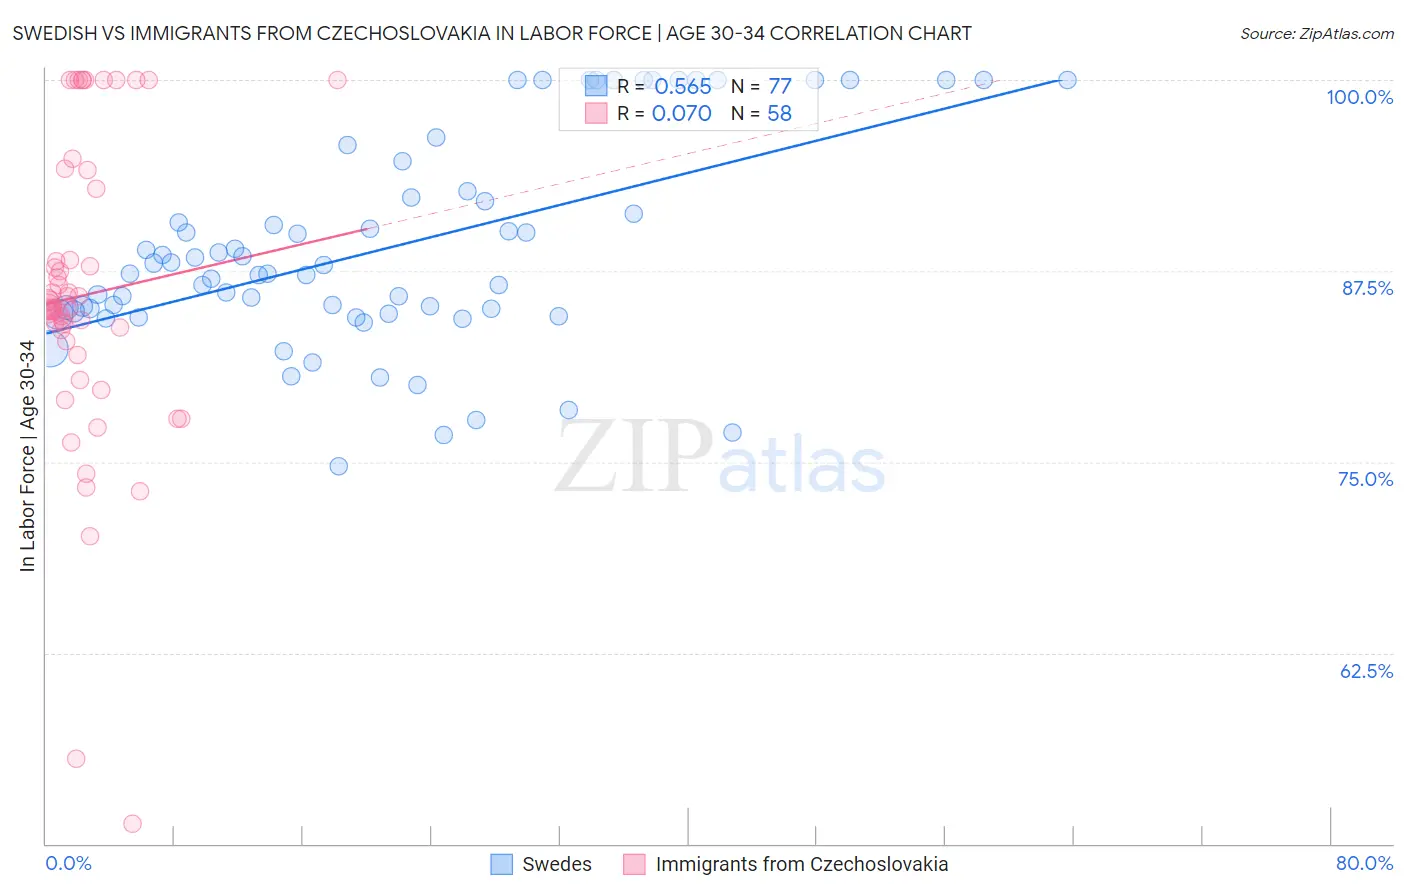
Swedish vs Immigrants from Czechoslovakia In Labor Force | Age 30-34 Correlation Chart
The statistical analysis conducted on geographies consisting of 538,314,811 people shows a substantial positive correlation between the proportion of Swedes and labor force participation rate among population between the ages 30 and 34 in the United States with a correlation coefficient (R) of 0.565 and weighted average of 85.2%. Similarly, the statistical analysis conducted on geographies consisting of 195,412,342 people shows a slight positive correlation between the proportion of Immigrants from Czechoslovakia and labor force participation rate among population between the ages 30 and 34 in the United States with a correlation coefficient (R) of 0.070 and weighted average of 85.4%, a difference of 0.16%.
In Labor Force | Age 30-34 Correlation Summary
| Measurement | Swedish | Immigrants from Czechoslovakia |
| Minimum | 74.7% | 51.3% |
| Maximum | 100.0% | 100.0% |
| Range | 25.3% | 48.7% |
| Mean | 89.0% | 85.9% |
| Median | 87.3% | 85.1% |
| Interquartile 25% (IQ1) | 84.8% | 82.9% |
| Interquartile 75% (IQ3) | 92.5% | 92.9% |
| Interquartile Range (IQR) | 7.7% | 10.0% |
| Standard Deviation (Sample) | 6.8% | 10.1% |
| Standard Deviation (Population) | 6.7% | 10.0% |
Demographics Similar to Swedes and Immigrants from Czechoslovakia by In Labor Force | Age 30-34
In terms of in labor force | age 30-34, the demographic groups most similar to Swedes are Immigrants from Norway (85.2%, a difference of 0.010%), German Russian (85.2%, a difference of 0.020%), Immigrants from Moldova (85.3%, a difference of 0.030%), Burmese (85.3%, a difference of 0.040%), and Immigrants from Kazakhstan (85.3%, a difference of 0.050%). Similarly, the demographic groups most similar to Immigrants from Czechoslovakia are Iranian (85.4%, a difference of 0.0%), Maltese (85.4%, a difference of 0.010%), Immigrants from Eastern Asia (85.4%, a difference of 0.010%), Immigrants from Singapore (85.3%, a difference of 0.030%), and Immigrants from Switzerland (85.3%, a difference of 0.040%).
| Demographics | Rating | Rank | In Labor Force | Age 30-34 |
| Maltese | 99.0 /100 | #74 | Exceptional 85.4% |
| Immigrants | Czechoslovakia | 99.0 /100 | #75 | Exceptional 85.4% |
| Iranians | 99.0 /100 | #76 | Exceptional 85.4% |
| Immigrants | Eastern Asia | 98.9 /100 | #77 | Exceptional 85.4% |
| Immigrants | Singapore | 98.8 /100 | #78 | Exceptional 85.3% |
| Immigrants | Switzerland | 98.7 /100 | #79 | Exceptional 85.3% |
| Immigrants | Russia | 98.7 /100 | #80 | Exceptional 85.3% |
| Slovaks | 98.7 /100 | #81 | Exceptional 85.3% |
| Immigrants | Africa | 98.6 /100 | #82 | Exceptional 85.3% |
| Immigrants | Europe | 98.6 /100 | #83 | Exceptional 85.3% |
| Greeks | 98.6 /100 | #84 | Exceptional 85.3% |
| Mongolians | 98.5 /100 | #85 | Exceptional 85.3% |
| Immigrants | Taiwan | 98.3 /100 | #86 | Exceptional 85.3% |
| Immigrants | Northern Europe | 98.2 /100 | #87 | Exceptional 85.3% |
| Immigrants | Belgium | 98.2 /100 | #88 | Exceptional 85.3% |
| Immigrants | Kazakhstan | 98.1 /100 | #89 | Exceptional 85.3% |
| Burmese | 97.9 /100 | #90 | Exceptional 85.3% |
| Immigrants | Moldova | 97.9 /100 | #91 | Exceptional 85.3% |
| German Russians | 97.7 /100 | #92 | Exceptional 85.2% |
| Immigrants | Norway | 97.6 /100 | #93 | Exceptional 85.2% |
| Swedes | 97.5 /100 | #94 | Exceptional 85.2% |