Swedish vs Immigrants from Czechoslovakia Disability Age Over 75
COMPARE
Swedish
Immigrants from Czechoslovakia
Disability Age Over 75
Disability Age Over 75 Comparison
Swedes
Immigrants from Czechoslovakia
45.7%
DISABILITY AGE OVER 75
99.8/ 100
METRIC RATING
46th/ 347
METRIC RANK
45.1%
DISABILITY AGE OVER 75
100.0/ 100
METRIC RATING
12th/ 347
METRIC RANK
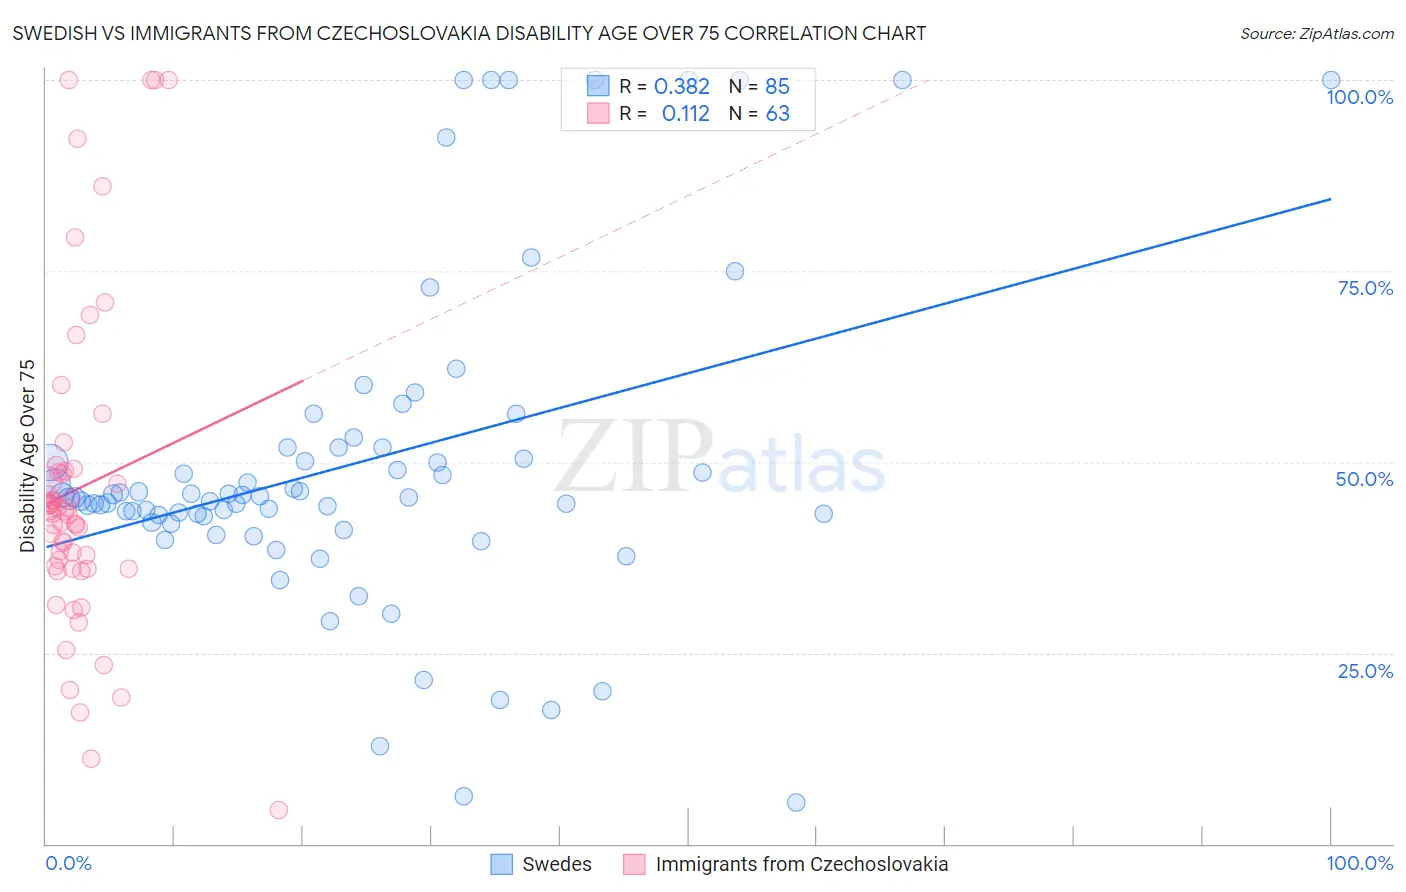
Swedish vs Immigrants from Czechoslovakia Disability Age Over 75 Correlation Chart
The statistical analysis conducted on geographies consisting of 537,534,553 people shows a mild positive correlation between the proportion of Swedes and percentage of population with a disability over the age of 75 in the United States with a correlation coefficient (R) of 0.382 and weighted average of 45.7%. Similarly, the statistical analysis conducted on geographies consisting of 195,428,919 people shows a poor positive correlation between the proportion of Immigrants from Czechoslovakia and percentage of population with a disability over the age of 75 in the United States with a correlation coefficient (R) of 0.112 and weighted average of 45.1%, a difference of 1.3%.
Disability Age Over 75 Correlation Summary
| Measurement | Swedish | Immigrants from Czechoslovakia |
| Minimum | 5.4% | 4.4% |
| Maximum | 100.0% | 100.0% |
| Range | 94.6% | 95.6% |
| Mean | 49.7% | 46.5% |
| Median | 45.3% | 43.5% |
| Interquartile 25% (IQ1) | 42.5% | 36.1% |
| Interquartile 75% (IQ3) | 51.8% | 48.7% |
| Interquartile Range (IQR) | 9.4% | 12.7% |
| Standard Deviation (Sample) | 20.9% | 20.8% |
| Standard Deviation (Population) | 20.7% | 20.6% |
Similar Demographics by Disability Age Over 75
Demographics Similar to Swedes by Disability Age Over 75
In terms of disability age over 75, the demographic groups most similar to Swedes are Immigrants from Canada (45.7%, a difference of 0.020%), Croatian (45.7%, a difference of 0.020%), Australian (45.7%, a difference of 0.030%), Turkish (45.7%, a difference of 0.030%), and Greek (45.6%, a difference of 0.070%).
| Demographics | Rating | Rank | Disability Age Over 75 |
| Estonians | 99.9 /100 | #39 | Exceptional 45.6% |
| Slovenes | 99.9 /100 | #40 | Exceptional 45.6% |
| Immigrants | Singapore | 99.8 /100 | #41 | Exceptional 45.6% |
| Greeks | 99.8 /100 | #42 | Exceptional 45.6% |
| Czechs | 99.8 /100 | #43 | Exceptional 45.7% |
| Australians | 99.8 /100 | #44 | Exceptional 45.7% |
| Turks | 99.8 /100 | #45 | Exceptional 45.7% |
| Swedes | 99.8 /100 | #46 | Exceptional 45.7% |
| Immigrants | Canada | 99.8 /100 | #47 | Exceptional 45.7% |
| Croatians | 99.8 /100 | #48 | Exceptional 45.7% |
| Immigrants | North America | 99.8 /100 | #49 | Exceptional 45.7% |
| Belgians | 99.7 /100 | #50 | Exceptional 45.8% |
| Immigrants | Korea | 99.7 /100 | #51 | Exceptional 45.8% |
| Immigrants | France | 99.7 /100 | #52 | Exceptional 45.8% |
| Immigrants | Italy | 99.7 /100 | #53 | Exceptional 45.8% |
Demographics Similar to Immigrants from Czechoslovakia by Disability Age Over 75
In terms of disability age over 75, the demographic groups most similar to Immigrants from Czechoslovakia are Latvian (45.1%, a difference of 0.010%), Immigrants from Scotland (45.1%, a difference of 0.020%), Immigrants from Sweden (45.1%, a difference of 0.060%), Lithuanian (45.1%, a difference of 0.10%), and Bulgarian (45.1%, a difference of 0.14%).
| Demographics | Rating | Rank | Disability Age Over 75 |
| Luxembourgers | 100.0 /100 | #5 | Exceptional 44.8% |
| Immigrants | Lithuania | 100.0 /100 | #6 | Exceptional 44.9% |
| Okinawans | 100.0 /100 | #7 | Exceptional 44.9% |
| Immigrants | Austria | 100.0 /100 | #8 | Exceptional 44.9% |
| Paraguayans | 100.0 /100 | #9 | Exceptional 45.0% |
| Bulgarians | 100.0 /100 | #10 | Exceptional 45.1% |
| Lithuanians | 100.0 /100 | #11 | Exceptional 45.1% |
| Immigrants | Czechoslovakia | 100.0 /100 | #12 | Exceptional 45.1% |
| Latvians | 100.0 /100 | #13 | Exceptional 45.1% |
| Immigrants | Scotland | 100.0 /100 | #14 | Exceptional 45.1% |
| Immigrants | Sweden | 100.0 /100 | #15 | Exceptional 45.1% |
| Immigrants | Northern Europe | 100.0 /100 | #16 | Exceptional 45.2% |
| Immigrants | India | 100.0 /100 | #17 | Exceptional 45.2% |
| Bolivians | 100.0 /100 | #18 | Exceptional 45.2% |
| Immigrants | Greece | 100.0 /100 | #19 | Exceptional 45.2% |