Swedish vs Immigrants from Czechoslovakia Unemployment Among Seniors over 75 years
COMPARE
Swedish
Immigrants from Czechoslovakia
Unemployment Among Seniors over 75 years
Unemployment Among Seniors over 75 years Comparison
Swedes
Immigrants from Czechoslovakia
10.0%
UNEMPLOYMENT AMONG SENIORS OVER 75 YEARS
0.0/ 100
METRIC RATING
305th/ 347
METRIC RANK
8.4%
UNEMPLOYMENT AMONG SENIORS OVER 75 YEARS
93.4/ 100
METRIC RATING
134th/ 347
METRIC RANK
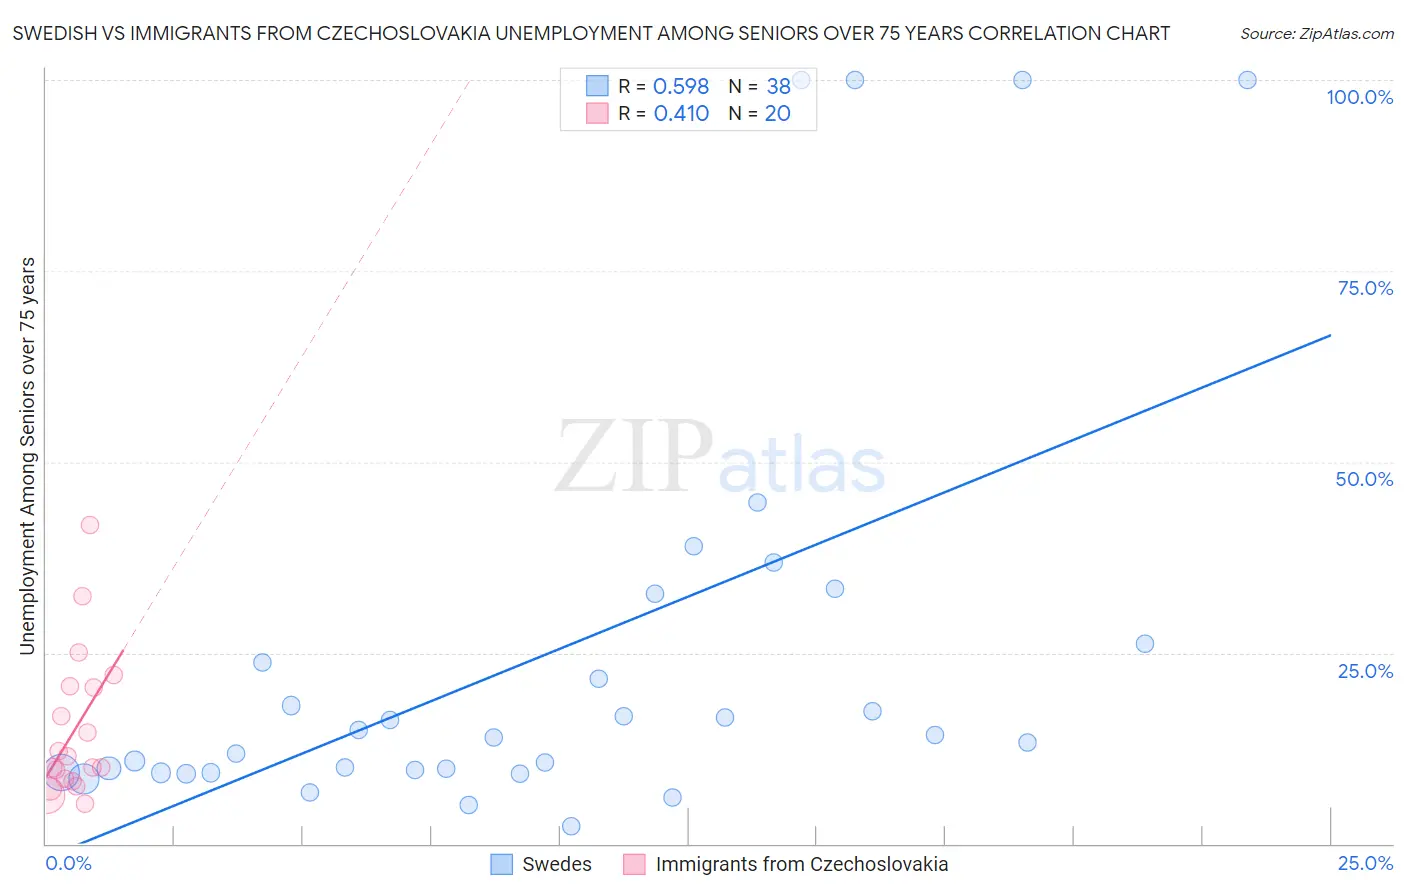
Swedish vs Immigrants from Czechoslovakia Unemployment Among Seniors over 75 years Correlation Chart
The statistical analysis conducted on geographies consisting of 229,693,656 people shows a substantial positive correlation between the proportion of Swedes and unemployment rate among seniors over the age of 75 in the United States with a correlation coefficient (R) of 0.598 and weighted average of 10.0%. Similarly, the statistical analysis conducted on geographies consisting of 126,790,513 people shows a moderate positive correlation between the proportion of Immigrants from Czechoslovakia and unemployment rate among seniors over the age of 75 in the United States with a correlation coefficient (R) of 0.410 and weighted average of 8.4%, a difference of 18.4%.
Unemployment Among Seniors over 75 years Correlation Summary
| Measurement | Swedish | Immigrants from Czechoslovakia |
| Minimum | 2.3% | 5.2% |
| Maximum | 100.0% | 41.7% |
| Range | 97.7% | 36.6% |
| Mean | 24.9% | 15.0% |
| Median | 14.1% | 10.7% |
| Interquartile 25% (IQ1) | 9.4% | 8.4% |
| Interquartile 75% (IQ3) | 26.2% | 20.5% |
| Interquartile Range (IQR) | 16.8% | 12.2% |
| Standard Deviation (Sample) | 27.9% | 9.6% |
| Standard Deviation (Population) | 27.5% | 9.3% |
Similar Demographics by Unemployment Among Seniors over 75 years
Demographics Similar to Swedes by Unemployment Among Seniors over 75 years
In terms of unemployment among seniors over 75 years, the demographic groups most similar to Swedes are Italian (10.0%, a difference of 0.15%), Scotch-Irish (10.0%, a difference of 0.19%), Puget Sound Salish (10.0%, a difference of 0.20%), Finnish (10.0%, a difference of 0.27%), and Immigrants from Fiji (10.0%, a difference of 0.27%).
| Demographics | Rating | Rank | Unemployment Among Seniors over 75 years |
| Lithuanians | 0.0 /100 | #298 | Tragic 9.9% |
| Belgians | 0.0 /100 | #299 | Tragic 9.9% |
| Iraqis | 0.0 /100 | #300 | Tragic 9.9% |
| Welsh | 0.0 /100 | #301 | Tragic 10.0% |
| Finns | 0.0 /100 | #302 | Tragic 10.0% |
| Puget Sound Salish | 0.0 /100 | #303 | Tragic 10.0% |
| Scotch-Irish | 0.0 /100 | #304 | Tragic 10.0% |
| Swedes | 0.0 /100 | #305 | Tragic 10.0% |
| Italians | 0.0 /100 | #306 | Tragic 10.0% |
| Immigrants | Fiji | 0.0 /100 | #307 | Tragic 10.0% |
| Whites/Caucasians | 0.0 /100 | #308 | Tragic 10.1% |
| English | 0.0 /100 | #309 | Tragic 10.1% |
| Hungarians | 0.0 /100 | #310 | Tragic 10.1% |
| Scottish | 0.0 /100 | #311 | Tragic 10.1% |
| Chippewa | 0.0 /100 | #312 | Tragic 10.1% |
Demographics Similar to Immigrants from Czechoslovakia by Unemployment Among Seniors over 75 years
In terms of unemployment among seniors over 75 years, the demographic groups most similar to Immigrants from Czechoslovakia are Serbian (8.4%, a difference of 0.080%), Chilean (8.4%, a difference of 0.11%), German Russian (8.4%, a difference of 0.39%), Haitian (8.5%, a difference of 0.39%), and Apache (8.4%, a difference of 0.48%).
| Demographics | Rating | Rank | Unemployment Among Seniors over 75 years |
| Hondurans | 96.2 /100 | #127 | Exceptional 8.4% |
| Native Hawaiians | 96.1 /100 | #128 | Exceptional 8.4% |
| Ghanaians | 96.0 /100 | #129 | Exceptional 8.4% |
| Apache | 95.2 /100 | #130 | Exceptional 8.4% |
| German Russians | 94.9 /100 | #131 | Exceptional 8.4% |
| Chileans | 93.8 /100 | #132 | Exceptional 8.4% |
| Serbians | 93.7 /100 | #133 | Exceptional 8.4% |
| Immigrants | Czechoslovakia | 93.4 /100 | #134 | Exceptional 8.4% |
| Haitians | 91.4 /100 | #135 | Exceptional 8.5% |
| Immigrants | Trinidad and Tobago | 90.8 /100 | #136 | Exceptional 8.5% |
| Immigrants | Kuwait | 90.5 /100 | #137 | Exceptional 8.5% |
| Immigrants | Bulgaria | 89.6 /100 | #138 | Excellent 8.5% |
| Barbadians | 88.6 /100 | #139 | Excellent 8.5% |
| South Americans | 87.9 /100 | #140 | Excellent 8.5% |
| Immigrants | Bolivia | 87.9 /100 | #141 | Excellent 8.5% |