Honduran vs Immigrants from Czechoslovakia In Labor Force | Age 30-34

COMPARE

Honduran
Race
Ancestry
AfghanAfricanAlaska NativeAlaskan AthabascanAlbanianAleutAlsatianAmericanApacheArabArapahoArgentineanArmenianAssyrian/Chaldean/SyriacAustralianAustrianBahamianBangladeshiBarbadianBasqueBelgianBelizeanBermudanBhutaneseBlackfeetBolivianBrazilianBritishBritish West IndianBulgarianBurmeseCajunCambodianCanadianCape VerdeanCarpatho RusynCelticCentral AmericanCentral American IndianCherokeeCheyenneChickasawChileanChineseChippewaChoctawColombianColvilleComancheCosta RicanCreeCreekCroatianCrowCubanCypriotCzechCzechoslovakianDanishDelawareDominicanDutchDutch West IndianEastern EuropeanEcuadorianEgyptianEnglishEstonianEthiopianEuropeanFijianFilipinoFinnishFrenchFrench American IndianFrench CanadianGermanGerman RussianGhanaianGreekGuamanian/ChamorroGuatemalanGuyaneseHaitianHmongHonduranHopiHoumaHungarianIcelanderIndian (Asian)IndonesianInupiatIranianIraqiIrishIroquoisIsraeliItalianJamaicanJapaneseJordanianKenyanKiowaKoreanLaotianLatvianLebaneseLiberianLithuanianLumbeeLuxembourgerMacedonianMalaysianMalteseMarshalleseMenomineeMexicanMexican American IndianMongolianMoroccanNative HawaiianNavajoNepaleseNew ZealanderNicaraguanNigerianNorthern EuropeanNorwegianOkinawanOsageOttawaPaiutePakistaniPalestinianPanamanianParaguayanPennsylvania GermanPeruvianPimaPolishPortuguesePotawatomiPuebloPuerto RicanPuget Sound SalishRomanianRussianSalvadoranSamoanScandinavianScotch-IrishScottishSeminoleSenegaleseSerbianShoshoneSierra LeoneanSiouxSlavicSlovakSloveneSomaliSouth AfricanSouth AmericanSouth American IndianSoviet UnionSpaniardSpanishSpanish AmericanSpanish American IndianSri LankanSubsaharan AfricanSudaneseSwedishSwissSyrianTaiwaneseThaiTlingit-HaidaTohono O'OdhamTonganTrinidadian and TobagonianTsimshianTurkishU.S. Virgin IslanderUgandanUkrainianUruguayanUteVenezuelanVietnameseWelshWest IndianYakamaYaquiYugoslavianYumanYup'ikZimbabwean
Immigration
NonimmigrantsImmigrantsAfghanistanAfricaAlbaniaArgentinaArmeniaAsiaAustraliaAustriaBahamasBangladeshBarbadosBelarusBelgiumBelizeBoliviaBosnia and HerzegovinaBrazilBulgariaBurma/MyanmarCabo VerdeCambodiaCameroonCanadaCaribbeanCentral AmericaChileChinaColombiaCongoCosta RicaCroatiaCubaDenmarkDominicaDominican RepublicEastern AfricaEastern AsiaEastern EuropeEcuadorEgyptEl SalvadorEnglandEritreaEthiopiaEuropeFijiFranceGermanyGhanaGreeceGrenadaGuatemalaGuyanaHaitiHondurasHong KongHungaryIndiaIndonesiaIranIraqIrelandIsraelItalyJamaicaJapanJordanKazakhstanKenyaKoreaKuwaitLaosLatin AmericaLatviaLebanonLiberiaLithuaniaMalaysiaMexicoMicronesiaMiddle AfricaMoldovaMoroccoNepalNetherlandsNicaraguaNigeriaNorth AmericaNorth MacedoniaNorthern AfricaNorthern EuropeNorwayOceaniaPakistanPanamaPeruPhilippinesPolandPortugalRomaniaRussiaSaudi ArabiaScotlandSenegalSerbiaSierra LeoneSingaporeSomaliaSouth AfricaSouth AmericaSouth Central AsiaSouth Eastern AsiaSouthern EuropeSpainSri LankaSt. Vincent and the GrenadinesSudanSwedenSwitzerlandSyriaTaiwanThailandTrinidad and TobagoTurkeyUgandaUkraineUruguayUzbekistanVenezuelaVietnamWest IndiesWestern AfricaWestern AsiaWestern EuropeYemenZaireZimbabweAzores
Immigrants from Czechoslovakia
Race
Ancestry
AfghanAfricanAlaska NativeAlaskan AthabascanAlbanianAleutAlsatianAmericanApacheArabArapahoArgentineanArmenianAssyrian/Chaldean/SyriacAustralianAustrianBahamianBangladeshiBarbadianBasqueBelgianBelizeanBermudanBhutaneseBlackfeetBolivianBrazilianBritishBritish West IndianBulgarianBurmeseCajunCambodianCanadianCape VerdeanCarpatho RusynCelticCentral AmericanCentral American IndianCherokeeCheyenneChickasawChileanChineseChippewaChoctawColombianColvilleComancheCosta RicanCreeCreekCroatianCrowCubanCypriotCzechCzechoslovakianDanishDelawareDominicanDutchDutch West IndianEastern EuropeanEcuadorianEgyptianEnglishEstonianEthiopianEuropeanFijianFilipinoFinnishFrenchFrench American IndianFrench CanadianGermanGerman RussianGhanaianGreekGuamanian/ChamorroGuatemalanGuyaneseHaitianHmongHopiHoumaHungarianIcelanderIndian (Asian)IndonesianInupiatIranianIraqiIrishIroquoisIsraeliItalianJamaicanJapaneseJordanianKenyanKiowaKoreanLaotianLatvianLebaneseLiberianLithuanianLumbeeLuxembourgerMacedonianMalaysianMalteseMarshalleseMenomineeMexicanMexican American IndianMongolianMoroccanNative HawaiianNavajoNepaleseNew ZealanderNicaraguanNigerianNorthern EuropeanNorwegianOkinawanOsageOttawaPaiutePakistaniPalestinianPanamanianParaguayanPennsylvania GermanPeruvianPimaPolishPortuguesePotawatomiPuebloPuerto RicanPuget Sound SalishRomanianRussianSalvadoranSamoanScandinavianScotch-IrishScottishSeminoleSenegaleseSerbianShoshoneSierra LeoneanSiouxSlavicSlovakSloveneSomaliSouth AfricanSouth AmericanSouth American IndianSoviet UnionSpaniardSpanishSpanish AmericanSpanish American IndianSri LankanSubsaharan AfricanSudaneseSwedishSwissSyrianTaiwaneseThaiTlingit-HaidaTohono O'OdhamTonganTrinidadian and TobagonianTsimshianTurkishU.S. Virgin IslanderUgandanUkrainianUruguayanUteVenezuelanVietnameseWelshWest IndianYakamaYaquiYugoslavianYumanYup'ikZimbabwean
Immigration
NonimmigrantsImmigrantsAfghanistanAfricaAlbaniaArgentinaArmeniaAsiaAustraliaAustriaBahamasBangladeshBarbadosBelarusBelgiumBelizeBoliviaBosnia and HerzegovinaBrazilBulgariaBurma/MyanmarCabo VerdeCambodiaCameroonCanadaCaribbeanCentral AmericaChileChinaColombiaCongoCosta RicaCroatiaCubaCzechoslovakiaDenmarkDominicaDominican RepublicEastern AfricaEastern AsiaEastern EuropeEcuadorEgyptEl SalvadorEnglandEritreaEthiopiaEuropeFijiFranceGermanyGhanaGreeceGrenadaGuatemalaGuyanaHaitiHondurasHong KongHungaryIndiaIndonesiaIranIraqIrelandIsraelItalyJamaicaJapanJordanKazakhstanKenyaKoreaKuwaitLaosLatin AmericaLatviaLebanonLiberiaLithuaniaMalaysiaMexicoMicronesiaMiddle AfricaMoldovaMoroccoNepalNetherlandsNicaraguaNigeriaNorth AmericaNorth MacedoniaNorthern AfricaNorthern EuropeNorwayOceaniaPakistanPanamaPeruPhilippinesPolandPortugalRomaniaRussiaSaudi ArabiaScotlandSenegalSerbiaSierra LeoneSingaporeSomaliaSouth AfricaSouth AmericaSouth Central AsiaSouth Eastern AsiaSouthern EuropeSpainSri LankaSt. Vincent and the GrenadinesSudanSwedenSwitzerlandSyriaTaiwanThailandTrinidad and TobagoTurkeyUgandaUkraineUruguayUzbekistanVenezuelaVietnamWest IndiesWestern AfricaWestern AsiaWestern EuropeYemenZaireZimbabweAzores
In Labor Force | Age 30-34
Income
Poverty
Unemployment
Labor Participation
Family Structure
Vehicle Availability
Education Level
Disability

In Labor Force | Age 30-34 Comparison

Hondurans

Immigrants from Czechoslovakia

Tragic
Exceptional
83.8%
IN LABOR FORCE | AGE 30-34
0.3/ 100
METRIC RATING
258th/ 347
METRIC RANK
85.4%
IN LABOR FORCE | AGE 30-34
99.0/ 100
METRIC RATING
75th/ 347
METRIC RANK

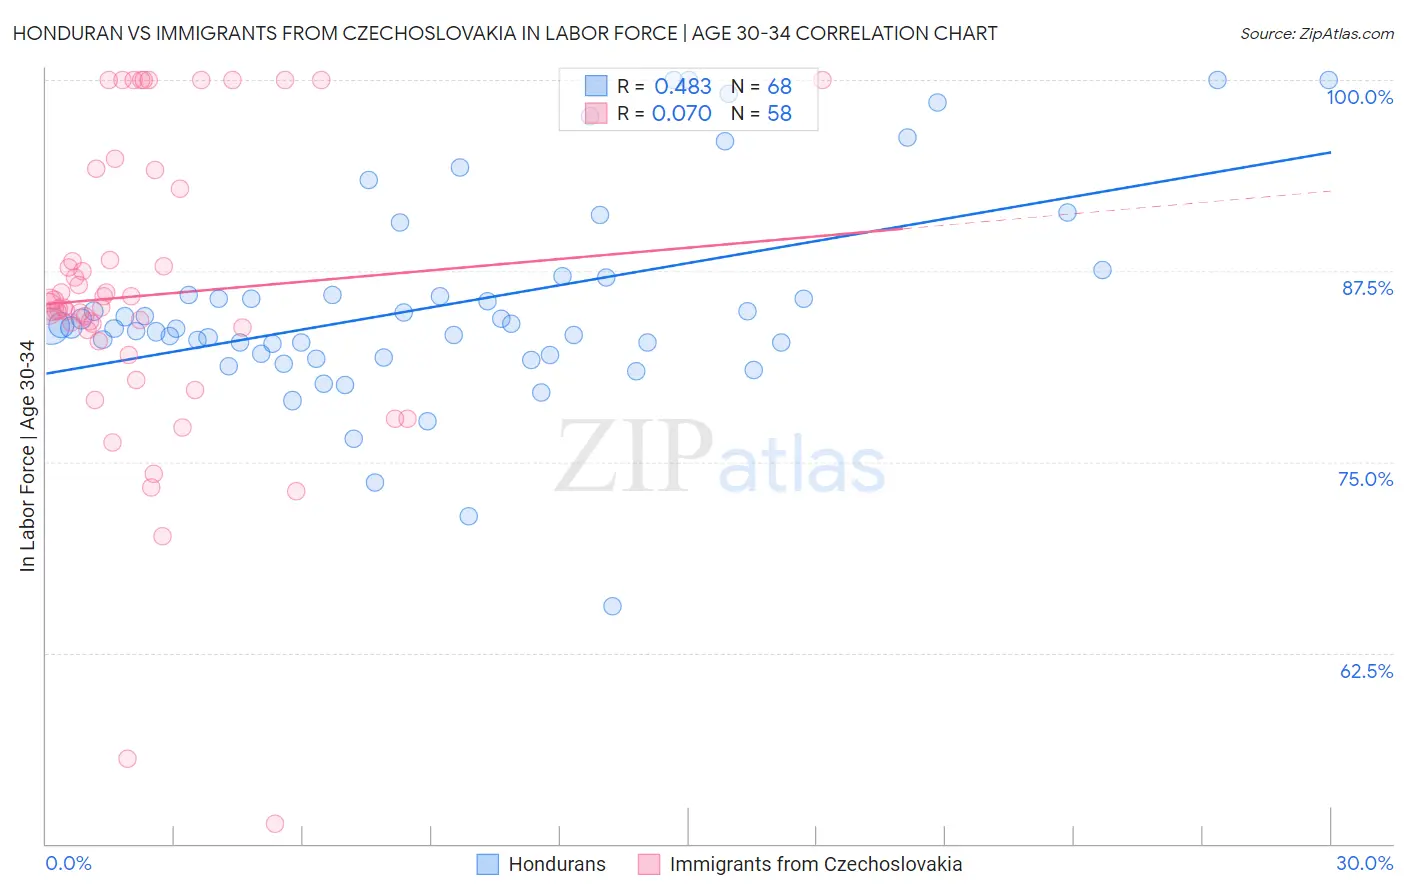
Honduran vs Immigrants from Czechoslovakia In Labor Force | Age 30-34 Correlation Chart

The statistical analysis conducted on geographies consisting of 357,599,463 people shows a moderate positive correlation between the proportion of Hondurans and labor force participation rate among population between the ages 30 and 34 in the United States with a correlation coefficient (R) of 0.483 and weighted average of 83.8%. Similarly, the statistical analysis conducted on geographies consisting of 195,412,342 people shows a slight positive correlation between the proportion of Immigrants from Czechoslovakia and labor force participation rate among population between the ages 30 and 34 in the United States with a correlation coefficient (R) of 0.070 and weighted average of 85.4%, a difference of 1.8%.
Honduran vs Immigrants from Czechoslovakia In Labor Force | Age 30-34

In Labor Force | Age 30-34 Correlation Summary

MeasurementHonduranImmigrants from Czechoslovakia
Minimum65.6%51.3%
Maximum100.0%100.0%
Range34.4%48.7%
Mean85.3%85.9%
Median83.8%85.1%
Interquartile 25% (IQ1)82.0%82.9%
Interquartile 75% (IQ3)86.5%92.9%
Interquartile Range (IQR)4.5%10.0%
Standard Deviation (Sample)6.8%10.1%
Standard Deviation (Population)6.7%10.0%

Similar Demographics by In Labor Force | Age 30-34

Demographics Similar to Hondurans by In Labor Force | Age 30-34

In terms of in labor force | age 30-34, the demographic groups most similar to Hondurans are Scotch-Irish (83.8%, a difference of 0.0%), Immigrants from Dominican Republic (83.8%, a difference of 0.020%), Iraqi (83.8%, a difference of 0.030%), Guyanese (83.8%, a difference of 0.030%), and Immigrants from Lebanon (83.9%, a difference of 0.040%).
DemographicsRating | RankIn Labor Force | Age 30-34
Nicaraguans
0.6
/100
|
#251
Tragic
83.9%
Bahamians
0.6
/100
|
#252
Tragic
83.9%
Immigrants | Nicaragua
0.6
/100
|
#253
Tragic
83.9%
Immigrants | St. Vincent and the Grenadines
0.5
/100
|
#254
Tragic
83.9%
Whites/Caucasians
0.5
/100
|
#255
Tragic
83.9%
Immigrants | Lebanon
0.4
/100
|
#256
Tragic
83.9%
Iraqis
0.3
/100
|
#257
Tragic
83.8%
Hondurans
0.3
/100
|
#258
Tragic
83.8%
Scotch-Irish
0.3
/100
|
#259
Tragic
83.8%
Immigrants | Dominican Republic
0.3
/100
|
#260
Tragic
83.8%
Guyanese
0.3
/100
|
#261
Tragic
83.8%
Dominicans
0.2
/100
|
#262
Tragic
83.8%
Immigrants | Guyana
0.2
/100
|
#263
Tragic
83.8%
Guatemalans
0.2
/100
|
#264
Tragic
83.7%
Immigrants | Honduras
0.1
/100
|
#265
Tragic
83.7%

Demographics Similar to Immigrants from Czechoslovakia by In Labor Force | Age 30-34

In terms of in labor force | age 30-34, the demographic groups most similar to Immigrants from Czechoslovakia are Iranian (85.4%, a difference of 0.0%), Immigrants from Japan (85.4%, a difference of 0.010%), Immigrants from China (85.4%, a difference of 0.010%), Indian (Asian) (85.4%, a difference of 0.010%), and Maltese (85.4%, a difference of 0.010%).
DemographicsRating | RankIn Labor Force | Age 30-34
Immigrants | Eastern Europe
99.3
/100
|
#68
Exceptional
85.4%
Immigrants | Iran
99.2
/100
|
#69
Exceptional
85.4%
Brazilians
99.1
/100
|
#70
Exceptional
85.4%
Immigrants | Japan
99.1
/100
|
#71
Exceptional
85.4%
Immigrants | China
99.0
/100
|
#72
Exceptional
85.4%
Indians (Asian)
99.0
/100
|
#73
Exceptional
85.4%
Maltese
99.0
/100
|
#74
Exceptional
85.4%
Immigrants | Czechoslovakia
99.0
/100
|
#75
Exceptional
85.4%
Iranians
99.0
/100
|
#76
Exceptional
85.4%
Immigrants | Eastern Asia
98.9
/100
|
#77
Exceptional
85.4%
Immigrants | Singapore
98.8
/100
|
#78
Exceptional
85.3%
Immigrants | Switzerland
98.7
/100
|
#79
Exceptional
85.3%
Immigrants | Russia
98.7
/100
|
#80
Exceptional
85.3%
Slovaks
98.7
/100
|
#81
Exceptional
85.3%
Immigrants | Africa
98.6
/100
|
#82
Exceptional
85.3%