Sudanese vs Welsh In Labor Force | Age 20-24
COMPARE
Sudanese
Welsh
In Labor Force | Age 20-24
In Labor Force | Age 20-24 Comparison
Sudanese
Welsh
78.4%
IN LABOR FORCE | AGE 20-24
100.0/ 100
METRIC RATING
15th/ 347
METRIC RANK
77.5%
IN LABOR FORCE | AGE 20-24
100.0/ 100
METRIC RATING
36th/ 347
METRIC RANK
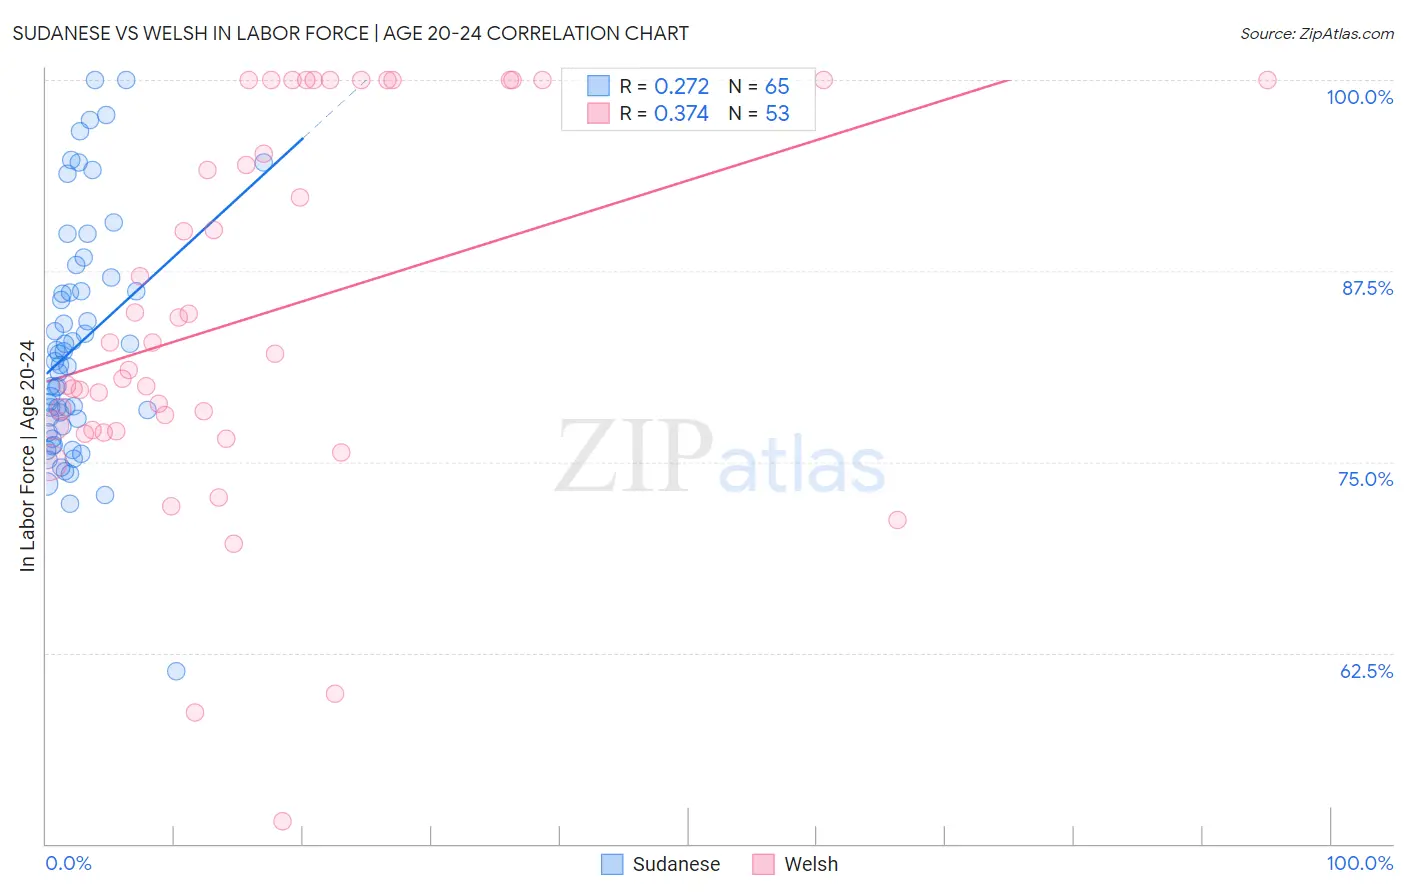
Sudanese vs Welsh In Labor Force | Age 20-24 Correlation Chart
The statistical analysis conducted on geographies consisting of 110,139,890 people shows a weak positive correlation between the proportion of Sudanese and labor force participation rate among population between the ages 20 and 24 in the United States with a correlation coefficient (R) of 0.272 and weighted average of 78.4%. Similarly, the statistical analysis conducted on geographies consisting of 527,767,201 people shows a mild positive correlation between the proportion of Welsh and labor force participation rate among population between the ages 20 and 24 in the United States with a correlation coefficient (R) of 0.374 and weighted average of 77.5%, a difference of 1.2%.
In Labor Force | Age 20-24 Correlation Summary
| Measurement | Sudanese | Welsh |
| Minimum | 61.3% | 51.4% |
| Maximum | 100.0% | 100.0% |
| Range | 38.7% | 48.6% |
| Mean | 82.6% | 84.7% |
| Median | 81.3% | 82.1% |
| Interquartile 25% (IQ1) | 77.1% | 77.1% |
| Interquartile 75% (IQ3) | 86.7% | 100.0% |
| Interquartile Range (IQR) | 9.5% | 22.9% |
| Standard Deviation (Sample) | 7.7% | 12.1% |
| Standard Deviation (Population) | 7.7% | 12.0% |
Similar Demographics by In Labor Force | Age 20-24
Demographics Similar to Sudanese by In Labor Force | Age 20-24
In terms of in labor force | age 20-24, the demographic groups most similar to Sudanese are Dutch (78.4%, a difference of 0.050%), Cape Verdean (78.3%, a difference of 0.090%), Czech (78.5%, a difference of 0.13%), Scandinavian (78.5%, a difference of 0.14%), and German (78.6%, a difference of 0.21%).
| Demographics | Rating | Rank | In Labor Force | Age 20-24 |
| Immigrants | Cabo Verde | 100.0 /100 | #8 | Exceptional 78.9% |
| Swedes | 100.0 /100 | #9 | Exceptional 78.8% |
| Slovenes | 100.0 /100 | #10 | Exceptional 78.7% |
| Finns | 100.0 /100 | #11 | Exceptional 78.7% |
| Germans | 100.0 /100 | #12 | Exceptional 78.6% |
| Scandinavians | 100.0 /100 | #13 | Exceptional 78.5% |
| Czechs | 100.0 /100 | #14 | Exceptional 78.5% |
| Sudanese | 100.0 /100 | #15 | Exceptional 78.4% |
| Dutch | 100.0 /100 | #16 | Exceptional 78.4% |
| Cape Verdeans | 100.0 /100 | #17 | Exceptional 78.3% |
| Immigrants | Bosnia and Herzegovina | 100.0 /100 | #18 | Exceptional 78.1% |
| Bangladeshis | 100.0 /100 | #19 | Exceptional 78.1% |
| French Canadians | 100.0 /100 | #20 | Exceptional 78.1% |
| Puget Sound Salish | 100.0 /100 | #21 | Exceptional 78.0% |
| Pennsylvania Germans | 100.0 /100 | #22 | Exceptional 78.0% |
Demographics Similar to Welsh by In Labor Force | Age 20-24
In terms of in labor force | age 20-24, the demographic groups most similar to Welsh are Czechoslovakian (77.5%, a difference of 0.010%), Immigrants from Eastern Africa (77.5%, a difference of 0.020%), German Russian (77.5%, a difference of 0.030%), Immigrants from Ethiopia (77.5%, a difference of 0.040%), and Marshallese (77.4%, a difference of 0.070%).
| Demographics | Rating | Rank | In Labor Force | Age 20-24 |
| Slovaks | 100.0 /100 | #29 | Exceptional 77.7% |
| Swiss | 100.0 /100 | #30 | Exceptional 77.7% |
| Poles | 100.0 /100 | #31 | Exceptional 77.6% |
| English | 100.0 /100 | #32 | Exceptional 77.6% |
| Immigrants | Ethiopia | 100.0 /100 | #33 | Exceptional 77.5% |
| German Russians | 100.0 /100 | #34 | Exceptional 77.5% |
| Immigrants | Eastern Africa | 100.0 /100 | #35 | Exceptional 77.5% |
| Welsh | 100.0 /100 | #36 | Exceptional 77.5% |
| Czechoslovakians | 100.0 /100 | #37 | Exceptional 77.5% |
| Marshallese | 100.0 /100 | #38 | Exceptional 77.4% |
| Irish | 100.0 /100 | #39 | Exceptional 77.4% |
| Scottish | 100.0 /100 | #40 | Exceptional 77.4% |
| Immigrants | Congo | 100.0 /100 | #41 | Exceptional 77.4% |
| French | 100.0 /100 | #42 | Exceptional 77.4% |
| Immigrants | Laos | 100.0 /100 | #43 | Exceptional 77.4% |