Sudanese vs Chilean In Labor Force | Age 20-24
COMPARE
Sudanese
Chilean
In Labor Force | Age 20-24
In Labor Force | Age 20-24 Comparison
Sudanese
Chileans
78.4%
IN LABOR FORCE | AGE 20-24
100.0/ 100
METRIC RATING
15th/ 347
METRIC RANK
74.5%
IN LABOR FORCE | AGE 20-24
12.5/ 100
METRIC RATING
217th/ 347
METRIC RANK
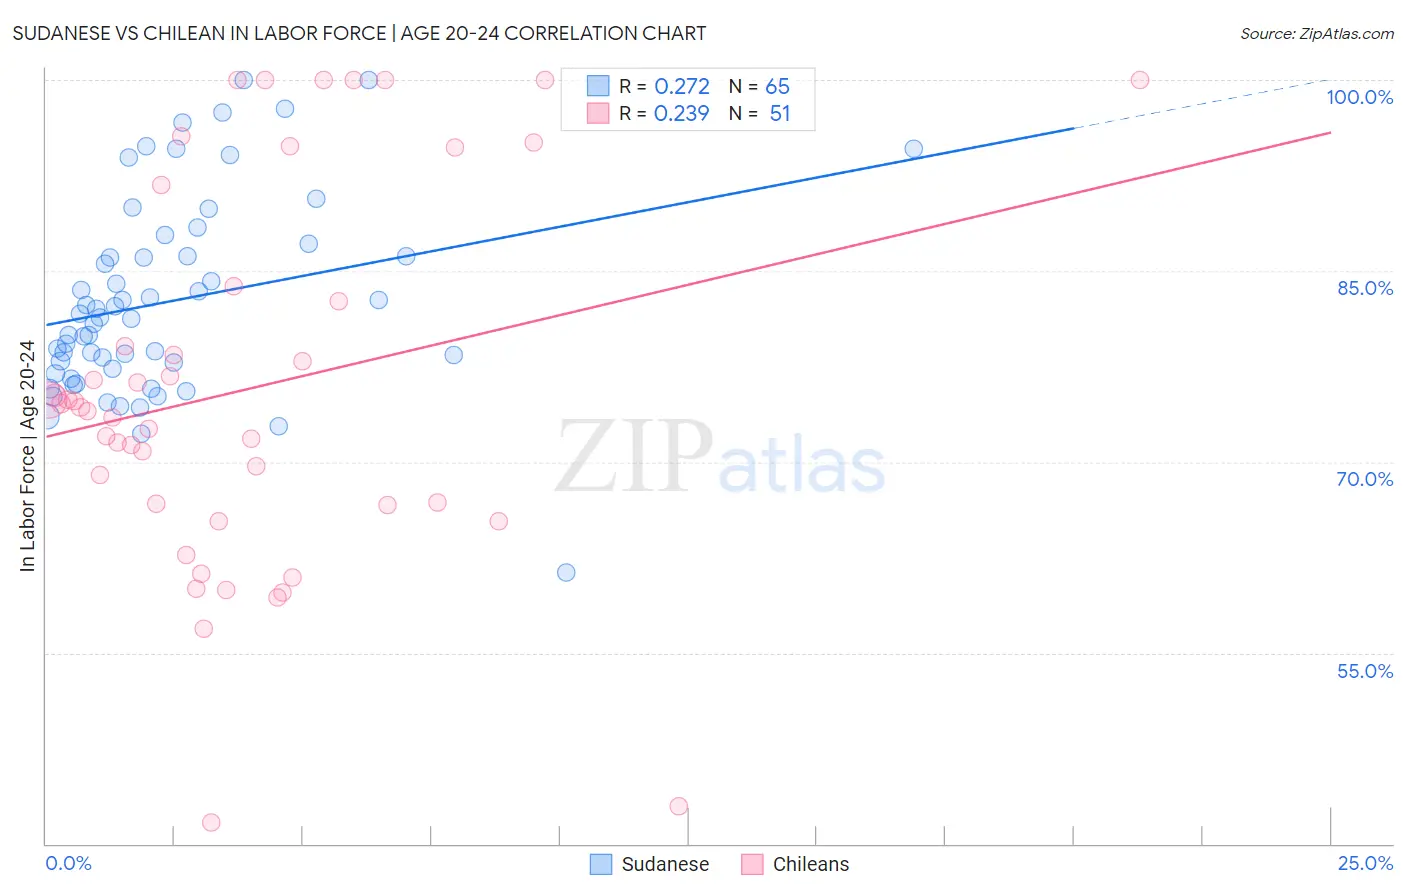
Sudanese vs Chilean In Labor Force | Age 20-24 Correlation Chart
The statistical analysis conducted on geographies consisting of 110,139,890 people shows a weak positive correlation between the proportion of Sudanese and labor force participation rate among population between the ages 20 and 24 in the United States with a correlation coefficient (R) of 0.272 and weighted average of 78.4%. Similarly, the statistical analysis conducted on geographies consisting of 256,670,531 people shows a weak positive correlation between the proportion of Chileans and labor force participation rate among population between the ages 20 and 24 in the United States with a correlation coefficient (R) of 0.239 and weighted average of 74.5%, a difference of 5.2%.
In Labor Force | Age 20-24 Correlation Summary
| Measurement | Sudanese | Chilean |
| Minimum | 61.3% | 41.7% |
| Maximum | 100.0% | 100.0% |
| Range | 38.7% | 58.3% |
| Mean | 82.6% | 75.8% |
| Median | 81.3% | 74.3% |
| Interquartile 25% (IQ1) | 77.1% | 66.6% |
| Interquartile 75% (IQ3) | 86.7% | 83.8% |
| Interquartile Range (IQR) | 9.5% | 17.3% |
| Standard Deviation (Sample) | 7.7% | 14.8% |
| Standard Deviation (Population) | 7.7% | 14.6% |
Similar Demographics by In Labor Force | Age 20-24
Demographics Similar to Sudanese by In Labor Force | Age 20-24
In terms of in labor force | age 20-24, the demographic groups most similar to Sudanese are Dutch (78.4%, a difference of 0.050%), Cape Verdean (78.3%, a difference of 0.090%), Czech (78.5%, a difference of 0.13%), Scandinavian (78.5%, a difference of 0.14%), and German (78.6%, a difference of 0.21%).
| Demographics | Rating | Rank | In Labor Force | Age 20-24 |
| Immigrants | Cabo Verde | 100.0 /100 | #8 | Exceptional 78.9% |
| Swedes | 100.0 /100 | #9 | Exceptional 78.8% |
| Slovenes | 100.0 /100 | #10 | Exceptional 78.7% |
| Finns | 100.0 /100 | #11 | Exceptional 78.7% |
| Germans | 100.0 /100 | #12 | Exceptional 78.6% |
| Scandinavians | 100.0 /100 | #13 | Exceptional 78.5% |
| Czechs | 100.0 /100 | #14 | Exceptional 78.5% |
| Sudanese | 100.0 /100 | #15 | Exceptional 78.4% |
| Dutch | 100.0 /100 | #16 | Exceptional 78.4% |
| Cape Verdeans | 100.0 /100 | #17 | Exceptional 78.3% |
| Immigrants | Bosnia and Herzegovina | 100.0 /100 | #18 | Exceptional 78.1% |
| Bangladeshis | 100.0 /100 | #19 | Exceptional 78.1% |
| French Canadians | 100.0 /100 | #20 | Exceptional 78.1% |
| Puget Sound Salish | 100.0 /100 | #21 | Exceptional 78.0% |
| Pennsylvania Germans | 100.0 /100 | #22 | Exceptional 78.0% |
Demographics Similar to Chileans by In Labor Force | Age 20-24
In terms of in labor force | age 20-24, the demographic groups most similar to Chileans are Immigrants from Ghana (74.5%, a difference of 0.010%), Immigrants from Kuwait (74.5%, a difference of 0.010%), Immigrants from Southern Europe (74.5%, a difference of 0.020%), Creek (74.5%, a difference of 0.030%), and Peruvian (74.5%, a difference of 0.030%).
| Demographics | Rating | Rank | In Labor Force | Age 20-24 |
| Uruguayans | 15.1 /100 | #210 | Poor 74.6% |
| Immigrants | Australia | 14.7 /100 | #211 | Poor 74.6% |
| Creek | 13.3 /100 | #212 | Poor 74.5% |
| Peruvians | 13.3 /100 | #213 | Poor 74.5% |
| Immigrants | Southern Europe | 13.2 /100 | #214 | Poor 74.5% |
| Immigrants | Ghana | 12.7 /100 | #215 | Poor 74.5% |
| Immigrants | Kuwait | 12.7 /100 | #216 | Poor 74.5% |
| Chileans | 12.5 /100 | #217 | Poor 74.5% |
| Immigrants | Peru | 10.6 /100 | #218 | Poor 74.5% |
| Nepalese | 10.5 /100 | #219 | Poor 74.5% |
| Immigrants | Norway | 10.3 /100 | #220 | Poor 74.5% |
| Chickasaw | 10.3 /100 | #221 | Poor 74.5% |
| Immigrants | India | 9.9 /100 | #222 | Tragic 74.4% |
| Hispanics or Latinos | 7.9 /100 | #223 | Tragic 74.4% |
| Seminole | 6.9 /100 | #224 | Tragic 74.3% |