Sudanese vs European In Labor Force | Age 20-24
COMPARE
Sudanese
European
In Labor Force | Age 20-24
In Labor Force | Age 20-24 Comparison
Sudanese
Europeans
78.4%
IN LABOR FORCE | AGE 20-24
100.0/ 100
METRIC RATING
15th/ 347
METRIC RANK
77.1%
IN LABOR FORCE | AGE 20-24
99.9/ 100
METRIC RATING
56th/ 347
METRIC RANK
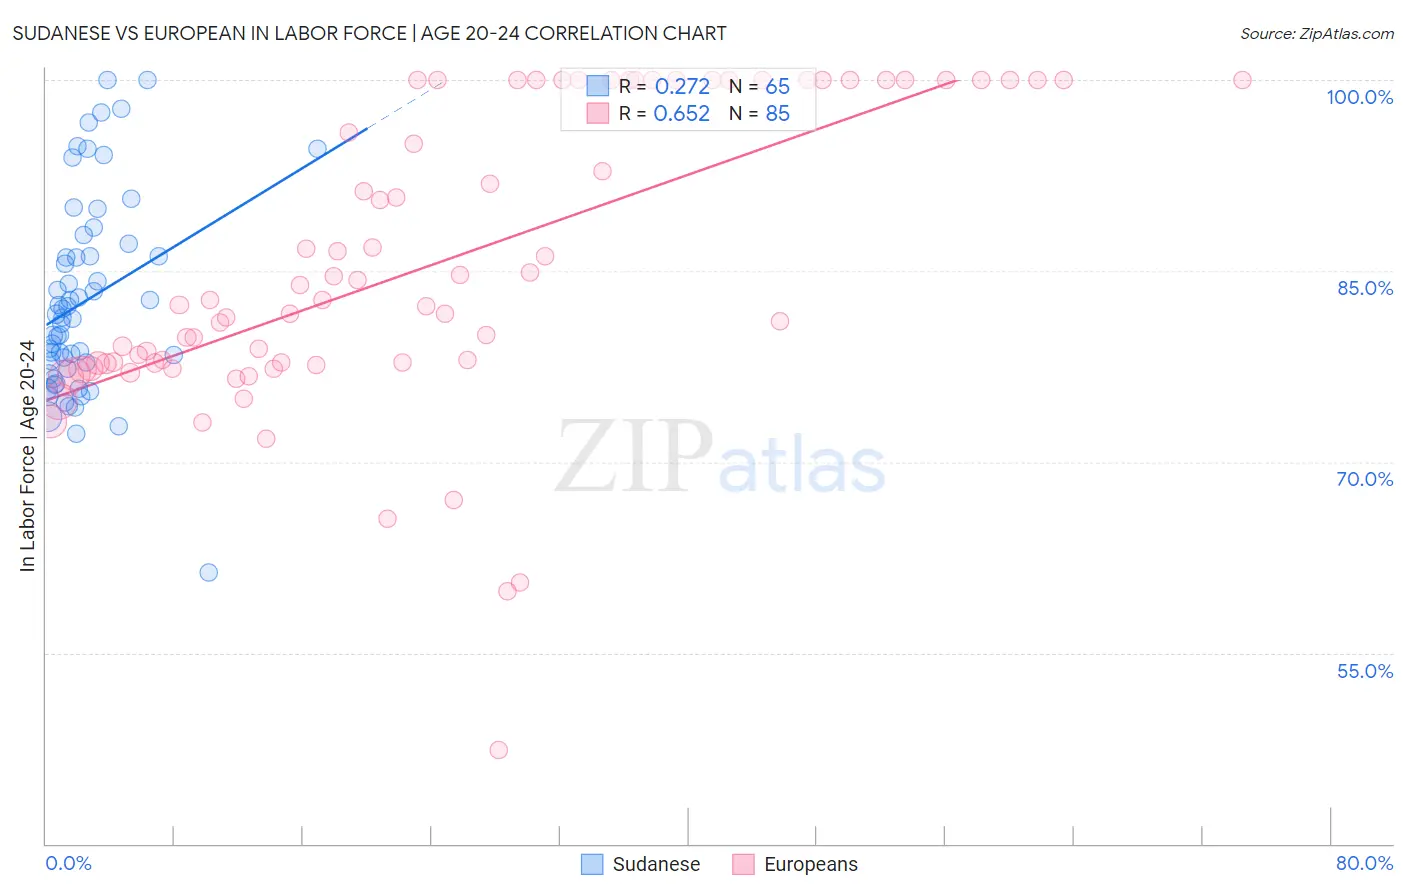
Sudanese vs European In Labor Force | Age 20-24 Correlation Chart
The statistical analysis conducted on geographies consisting of 110,139,890 people shows a weak positive correlation between the proportion of Sudanese and labor force participation rate among population between the ages 20 and 24 in the United States with a correlation coefficient (R) of 0.272 and weighted average of 78.4%. Similarly, the statistical analysis conducted on geographies consisting of 560,672,794 people shows a significant positive correlation between the proportion of Europeans and labor force participation rate among population between the ages 20 and 24 in the United States with a correlation coefficient (R) of 0.652 and weighted average of 77.1%, a difference of 1.7%.
In Labor Force | Age 20-24 Correlation Summary
| Measurement | Sudanese | European |
| Minimum | 61.3% | 47.4% |
| Maximum | 100.0% | 100.0% |
| Range | 38.7% | 52.6% |
| Mean | 82.6% | 85.5% |
| Median | 81.3% | 82.7% |
| Interquartile 25% (IQ1) | 77.1% | 77.7% |
| Interquartile 75% (IQ3) | 86.7% | 100.0% |
| Interquartile Range (IQR) | 9.5% | 22.3% |
| Standard Deviation (Sample) | 7.7% | 11.7% |
| Standard Deviation (Population) | 7.7% | 11.6% |
Similar Demographics by In Labor Force | Age 20-24
Demographics Similar to Sudanese by In Labor Force | Age 20-24
In terms of in labor force | age 20-24, the demographic groups most similar to Sudanese are Dutch (78.4%, a difference of 0.050%), Cape Verdean (78.3%, a difference of 0.090%), Czech (78.5%, a difference of 0.13%), Scandinavian (78.5%, a difference of 0.14%), and German (78.6%, a difference of 0.21%).
| Demographics | Rating | Rank | In Labor Force | Age 20-24 |
| Immigrants | Cabo Verde | 100.0 /100 | #8 | Exceptional 78.9% |
| Swedes | 100.0 /100 | #9 | Exceptional 78.8% |
| Slovenes | 100.0 /100 | #10 | Exceptional 78.7% |
| Finns | 100.0 /100 | #11 | Exceptional 78.7% |
| Germans | 100.0 /100 | #12 | Exceptional 78.6% |
| Scandinavians | 100.0 /100 | #13 | Exceptional 78.5% |
| Czechs | 100.0 /100 | #14 | Exceptional 78.5% |
| Sudanese | 100.0 /100 | #15 | Exceptional 78.4% |
| Dutch | 100.0 /100 | #16 | Exceptional 78.4% |
| Cape Verdeans | 100.0 /100 | #17 | Exceptional 78.3% |
| Immigrants | Bosnia and Herzegovina | 100.0 /100 | #18 | Exceptional 78.1% |
| Bangladeshis | 100.0 /100 | #19 | Exceptional 78.1% |
| French Canadians | 100.0 /100 | #20 | Exceptional 78.1% |
| Puget Sound Salish | 100.0 /100 | #21 | Exceptional 78.0% |
| Pennsylvania Germans | 100.0 /100 | #22 | Exceptional 78.0% |
Demographics Similar to Europeans by In Labor Force | Age 20-24
In terms of in labor force | age 20-24, the demographic groups most similar to Europeans are Immigrants from Liberia (77.1%, a difference of 0.010%), Chippewa (77.1%, a difference of 0.020%), Celtic (77.1%, a difference of 0.030%), Hawaiian (77.0%, a difference of 0.040%), and Scotch-Irish (77.0%, a difference of 0.060%).
| Demographics | Rating | Rank | In Labor Force | Age 20-24 |
| Chinese | 100.0 /100 | #49 | Exceptional 77.3% |
| Malaysians | 100.0 /100 | #50 | Exceptional 77.2% |
| Croatians | 100.0 /100 | #51 | Exceptional 77.2% |
| Indonesians | 100.0 /100 | #52 | Exceptional 77.2% |
| Immigrants | Azores | 100.0 /100 | #53 | Exceptional 77.2% |
| Celtics | 99.9 /100 | #54 | Exceptional 77.1% |
| Immigrants | Liberia | 99.9 /100 | #55 | Exceptional 77.1% |
| Europeans | 99.9 /100 | #56 | Exceptional 77.1% |
| Chippewa | 99.9 /100 | #57 | Exceptional 77.1% |
| Hawaiians | 99.9 /100 | #58 | Exceptional 77.0% |
| Scotch-Irish | 99.9 /100 | #59 | Exceptional 77.0% |
| Kenyans | 99.9 /100 | #60 | Exceptional 77.0% |
| Immigrants | Eritrea | 99.9 /100 | #61 | Exceptional 77.0% |
| Immigrants | Kenya | 99.9 /100 | #62 | Exceptional 77.0% |
| Lithuanians | 99.9 /100 | #63 | Exceptional 77.0% |