Sudanese vs Immigrants from Indonesia In Labor Force | Age 30-34
COMPARE
Sudanese
Immigrants from Indonesia
In Labor Force | Age 30-34
In Labor Force | Age 30-34 Comparison
Sudanese
Immigrants from Indonesia
85.2%
IN LABOR FORCE | AGE 30-34
97.1/ 100
METRIC RATING
100th/ 347
METRIC RANK
84.9%
IN LABOR FORCE | AGE 30-34
84.3/ 100
METRIC RATING
142nd/ 347
METRIC RANK
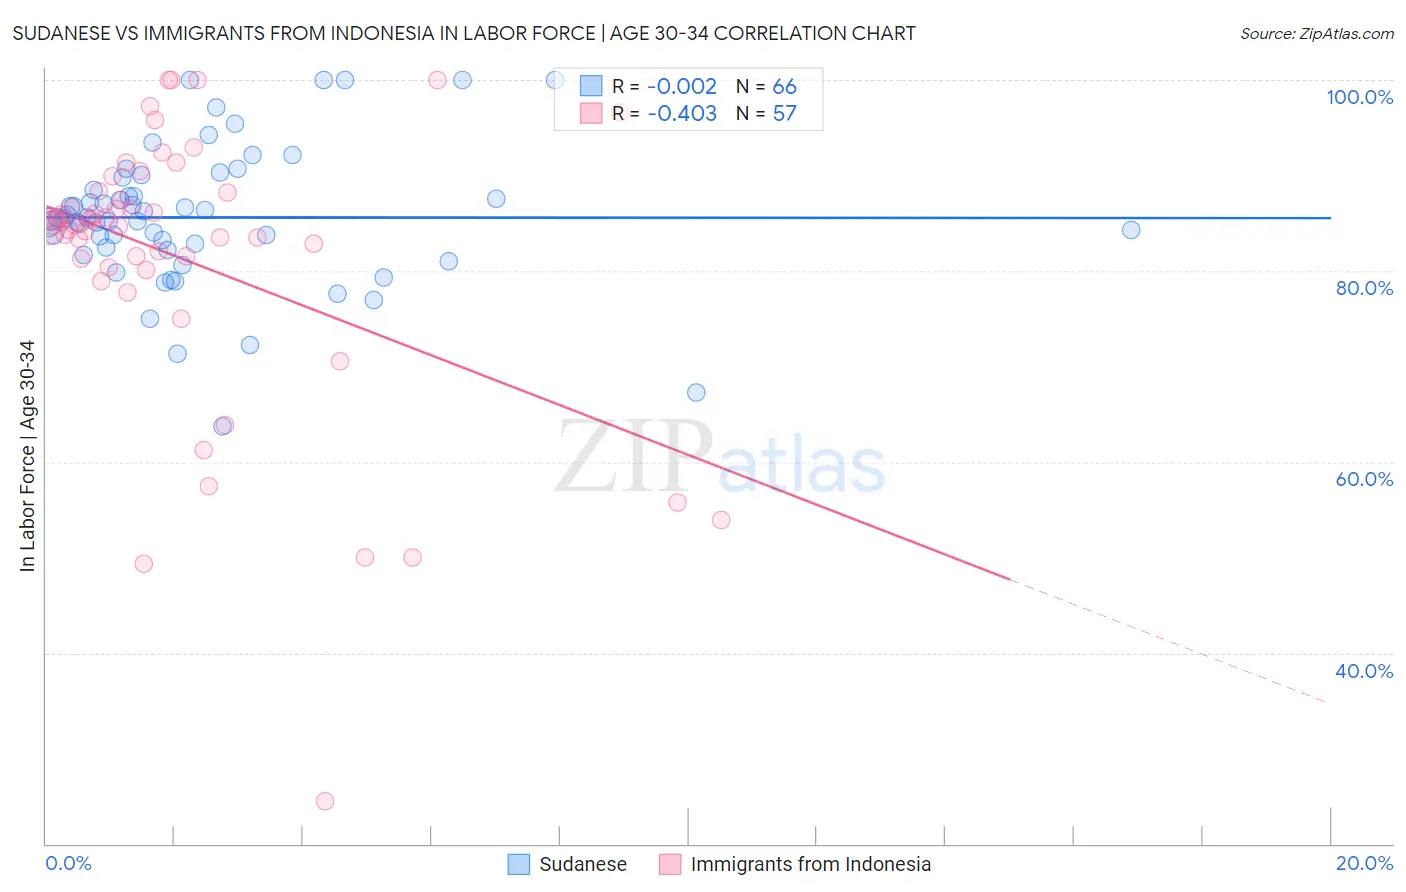
Sudanese vs Immigrants from Indonesia In Labor Force | Age 30-34 Correlation Chart
The statistical analysis conducted on geographies consisting of 110,111,574 people shows no correlation between the proportion of Sudanese and labor force participation rate among population between the ages 30 and 34 in the United States with a correlation coefficient (R) of -0.002 and weighted average of 85.2%. Similarly, the statistical analysis conducted on geographies consisting of 215,722,421 people shows a moderate negative correlation between the proportion of Immigrants from Indonesia and labor force participation rate among population between the ages 30 and 34 in the United States with a correlation coefficient (R) of -0.403 and weighted average of 84.9%, a difference of 0.32%.
In Labor Force | Age 30-34 Correlation Summary
| Measurement | Sudanese | Immigrants from Indonesia |
| Minimum | 63.7% | 24.5% |
| Maximum | 100.0% | 100.0% |
| Range | 36.3% | 75.5% |
| Mean | 85.6% | 81.2% |
| Median | 85.4% | 84.8% |
| Interquartile 25% (IQ1) | 82.4% | 80.3% |
| Interquartile 75% (IQ3) | 88.5% | 88.3% |
| Interquartile Range (IQR) | 6.1% | 8.0% |
| Standard Deviation (Sample) | 7.2% | 14.8% |
| Standard Deviation (Population) | 7.2% | 14.7% |
Similar Demographics by In Labor Force | Age 30-34
Demographics Similar to Sudanese by In Labor Force | Age 30-34
In terms of in labor force | age 30-34, the demographic groups most similar to Sudanese are Belgian (85.2%, a difference of 0.0%), Immigrants from Korea (85.2%, a difference of 0.010%), Thai (85.2%, a difference of 0.010%), Immigrants from Uganda (85.2%, a difference of 0.010%), and Immigrants from Belarus (85.2%, a difference of 0.010%).
| Demographics | Rating | Rank | In Labor Force | Age 30-34 |
| Immigrants | Norway | 97.6 /100 | #93 | Exceptional 85.2% |
| Swedes | 97.5 /100 | #94 | Exceptional 85.2% |
| Immigrants | India | 97.4 /100 | #95 | Exceptional 85.2% |
| Immigrants | Korea | 97.3 /100 | #96 | Exceptional 85.2% |
| Thais | 97.2 /100 | #97 | Exceptional 85.2% |
| Immigrants | Uganda | 97.2 /100 | #98 | Exceptional 85.2% |
| Belgians | 97.2 /100 | #99 | Exceptional 85.2% |
| Sudanese | 97.1 /100 | #100 | Exceptional 85.2% |
| Immigrants | Belarus | 96.9 /100 | #101 | Exceptional 85.2% |
| Immigrants | Austria | 96.8 /100 | #102 | Exceptional 85.2% |
| Ukrainians | 96.6 /100 | #103 | Exceptional 85.2% |
| Immigrants | Ghana | 96.5 /100 | #104 | Exceptional 85.2% |
| Alsatians | 96.3 /100 | #105 | Exceptional 85.2% |
| Immigrants | Middle Africa | 96.3 /100 | #106 | Exceptional 85.2% |
| Immigrants | Northern Africa | 96.3 /100 | #107 | Exceptional 85.2% |
Demographics Similar to Immigrants from Indonesia by In Labor Force | Age 30-34
In terms of in labor force | age 30-34, the demographic groups most similar to Immigrants from Indonesia are Chilean (84.9%, a difference of 0.010%), Immigrants from Vietnam (85.0%, a difference of 0.030%), Colombian (84.9%, a difference of 0.030%), South African (85.0%, a difference of 0.050%), and Sri Lankan (85.0%, a difference of 0.050%).
| Demographics | Rating | Rank | In Labor Force | Age 30-34 |
| Immigrants | Asia | 88.9 /100 | #135 | Excellent 85.0% |
| Jordanians | 88.6 /100 | #136 | Excellent 85.0% |
| South Africans | 88.0 /100 | #137 | Excellent 85.0% |
| Sri Lankans | 87.8 /100 | #138 | Excellent 85.0% |
| Bhutanese | 87.5 /100 | #139 | Excellent 85.0% |
| Immigrants | Vietnam | 86.5 /100 | #140 | Excellent 85.0% |
| Chileans | 85.3 /100 | #141 | Excellent 84.9% |
| Immigrants | Indonesia | 84.3 /100 | #142 | Excellent 84.9% |
| Colombians | 82.2 /100 | #143 | Excellent 84.9% |
| Uruguayans | 78.5 /100 | #144 | Good 84.9% |
| Palestinians | 77.7 /100 | #145 | Good 84.9% |
| Immigrants | Saudi Arabia | 76.6 /100 | #146 | Good 84.9% |
| Immigrants | Colombia | 76.3 /100 | #147 | Good 84.9% |
| Immigrants | Pakistan | 76.2 /100 | #148 | Good 84.9% |
| Immigrants | Ukraine | 75.1 /100 | #149 | Good 84.8% |