Sudanese vs Immigrants from Norway In Labor Force | Age 30-34
COMPARE
Sudanese
Immigrants from Norway
In Labor Force | Age 30-34
In Labor Force | Age 30-34 Comparison
Sudanese
Immigrants from Norway
85.2%
IN LABOR FORCE | AGE 30-34
97.1/ 100
METRIC RATING
100th/ 347
METRIC RANK
85.2%
IN LABOR FORCE | AGE 30-34
97.6/ 100
METRIC RATING
93rd/ 347
METRIC RANK
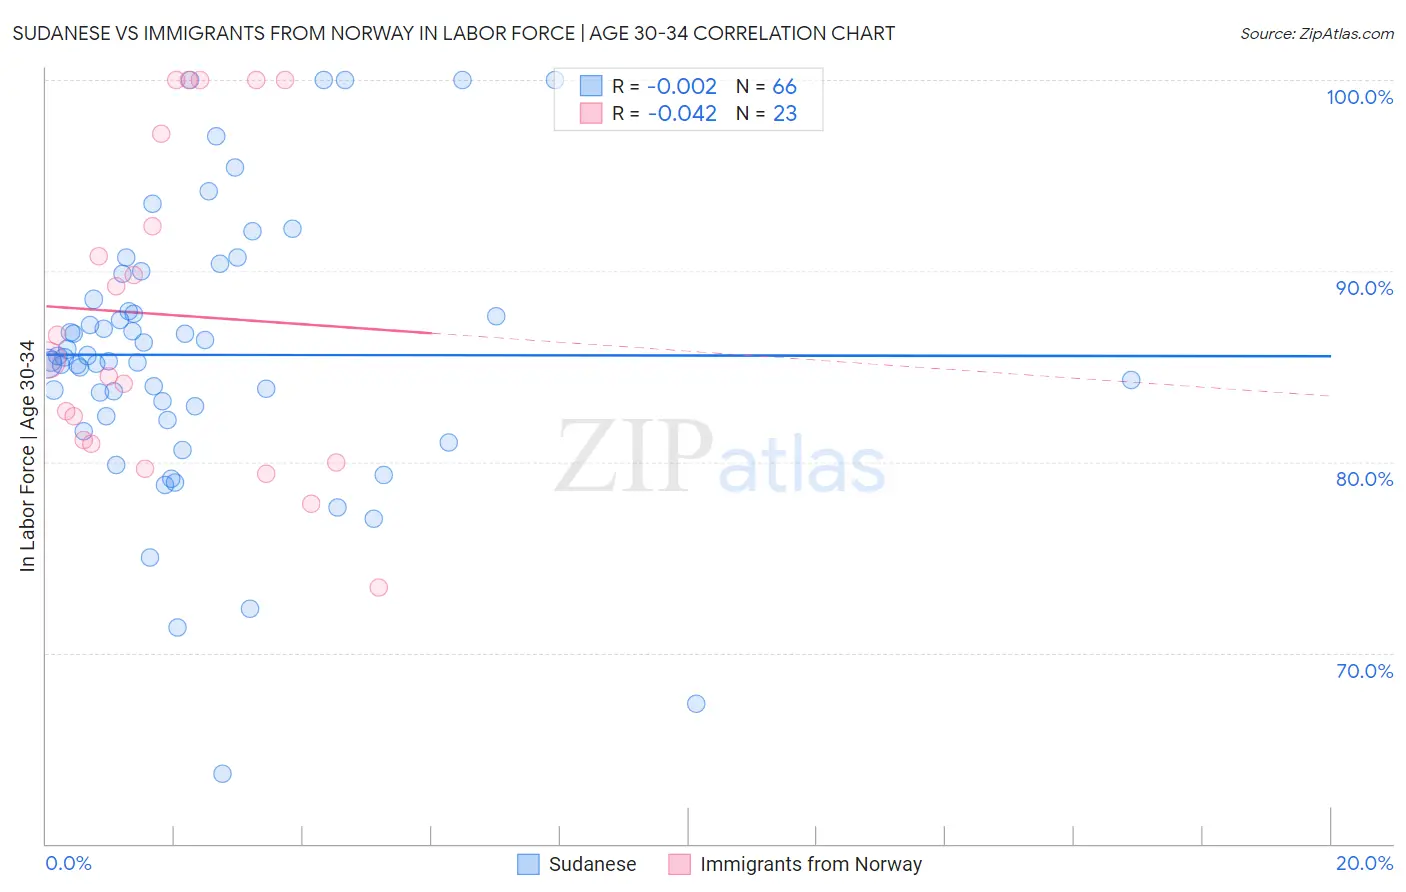
Sudanese vs Immigrants from Norway In Labor Force | Age 30-34 Correlation Chart
The statistical analysis conducted on geographies consisting of 110,111,574 people shows no correlation between the proportion of Sudanese and labor force participation rate among population between the ages 30 and 34 in the United States with a correlation coefficient (R) of -0.002 and weighted average of 85.2%. Similarly, the statistical analysis conducted on geographies consisting of 116,700,143 people shows no correlation between the proportion of Immigrants from Norway and labor force participation rate among population between the ages 30 and 34 in the United States with a correlation coefficient (R) of -0.042 and weighted average of 85.2%, a difference of 0.030%.
In Labor Force | Age 30-34 Correlation Summary
| Measurement | Sudanese | Immigrants from Norway |
| Minimum | 63.7% | 73.4% |
| Maximum | 100.0% | 100.0% |
| Range | 36.3% | 26.6% |
| Mean | 85.6% | 87.7% |
| Median | 85.4% | 85.4% |
| Interquartile 25% (IQ1) | 82.4% | 81.0% |
| Interquartile 75% (IQ3) | 88.5% | 97.2% |
| Interquartile Range (IQR) | 6.1% | 16.2% |
| Standard Deviation (Sample) | 7.2% | 8.4% |
| Standard Deviation (Population) | 7.2% | 8.2% |
Demographics Similar to Sudanese and Immigrants from Norway by In Labor Force | Age 30-34
In terms of in labor force | age 30-34, the demographic groups most similar to Sudanese are Belgian (85.2%, a difference of 0.0%), Immigrants from Korea (85.2%, a difference of 0.010%), Thai (85.2%, a difference of 0.010%), Immigrants from Uganda (85.2%, a difference of 0.010%), and Immigrants from Belarus (85.2%, a difference of 0.010%). Similarly, the demographic groups most similar to Immigrants from Norway are German Russian (85.2%, a difference of 0.010%), Swedish (85.2%, a difference of 0.010%), Immigrants from India (85.2%, a difference of 0.010%), Immigrants from Moldova (85.3%, a difference of 0.020%), and Immigrants from Korea (85.2%, a difference of 0.020%).
| Demographics | Rating | Rank | In Labor Force | Age 30-34 |
| Immigrants | Taiwan | 98.3 /100 | #86 | Exceptional 85.3% |
| Immigrants | Northern Europe | 98.2 /100 | #87 | Exceptional 85.3% |
| Immigrants | Belgium | 98.2 /100 | #88 | Exceptional 85.3% |
| Immigrants | Kazakhstan | 98.1 /100 | #89 | Exceptional 85.3% |
| Burmese | 97.9 /100 | #90 | Exceptional 85.3% |
| Immigrants | Moldova | 97.9 /100 | #91 | Exceptional 85.3% |
| German Russians | 97.7 /100 | #92 | Exceptional 85.2% |
| Immigrants | Norway | 97.6 /100 | #93 | Exceptional 85.2% |
| Swedes | 97.5 /100 | #94 | Exceptional 85.2% |
| Immigrants | India | 97.4 /100 | #95 | Exceptional 85.2% |
| Immigrants | Korea | 97.3 /100 | #96 | Exceptional 85.2% |
| Thais | 97.2 /100 | #97 | Exceptional 85.2% |
| Immigrants | Uganda | 97.2 /100 | #98 | Exceptional 85.2% |
| Belgians | 97.2 /100 | #99 | Exceptional 85.2% |
| Sudanese | 97.1 /100 | #100 | Exceptional 85.2% |
| Immigrants | Belarus | 96.9 /100 | #101 | Exceptional 85.2% |
| Immigrants | Austria | 96.8 /100 | #102 | Exceptional 85.2% |
| Ukrainians | 96.6 /100 | #103 | Exceptional 85.2% |
| Immigrants | Ghana | 96.5 /100 | #104 | Exceptional 85.2% |
| Alsatians | 96.3 /100 | #105 | Exceptional 85.2% |
| Immigrants | Middle Africa | 96.3 /100 | #106 | Exceptional 85.2% |