Icelander vs Immigrants from Indonesia In Labor Force | Age 30-34
COMPARE
Icelander
Immigrants from Indonesia
In Labor Force | Age 30-34
In Labor Force | Age 30-34 Comparison
Icelanders
Immigrants from Indonesia
84.7%
IN LABOR FORCE | AGE 30-34
56.8/ 100
METRIC RATING
164th/ 347
METRIC RANK
84.9%
IN LABOR FORCE | AGE 30-34
84.3/ 100
METRIC RATING
142nd/ 347
METRIC RANK
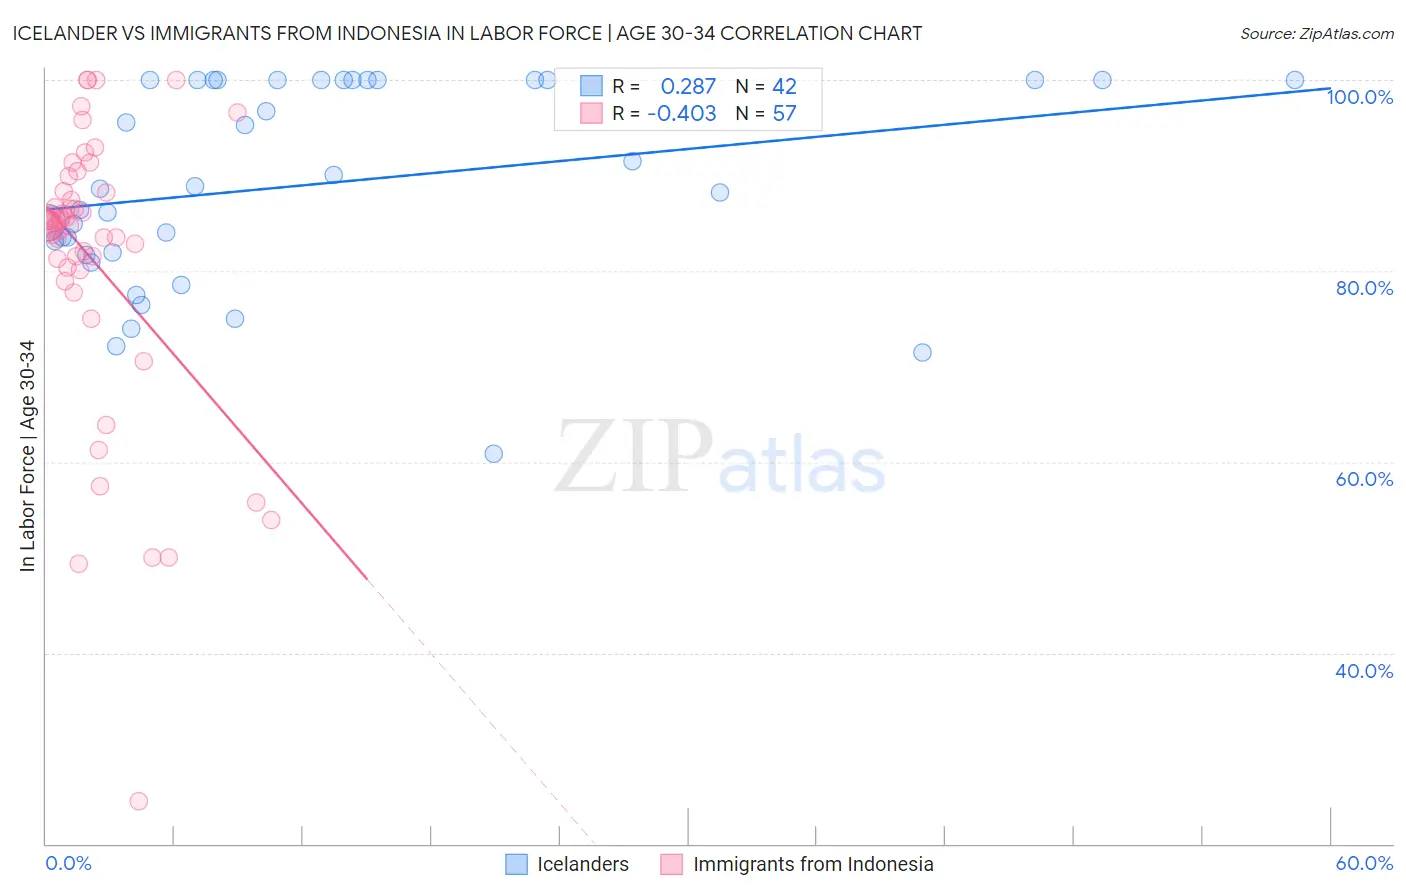
Icelander vs Immigrants from Indonesia In Labor Force | Age 30-34 Correlation Chart
The statistical analysis conducted on geographies consisting of 159,636,707 people shows a weak positive correlation between the proportion of Icelanders and labor force participation rate among population between the ages 30 and 34 in the United States with a correlation coefficient (R) of 0.287 and weighted average of 84.7%. Similarly, the statistical analysis conducted on geographies consisting of 215,722,421 people shows a moderate negative correlation between the proportion of Immigrants from Indonesia and labor force participation rate among population between the ages 30 and 34 in the United States with a correlation coefficient (R) of -0.403 and weighted average of 84.9%, a difference of 0.25%.
In Labor Force | Age 30-34 Correlation Summary
| Measurement | Icelander | Immigrants from Indonesia |
| Minimum | 60.9% | 24.5% |
| Maximum | 100.0% | 100.0% |
| Range | 39.1% | 75.5% |
| Mean | 89.1% | 81.2% |
| Median | 88.8% | 84.8% |
| Interquartile 25% (IQ1) | 82.0% | 80.3% |
| Interquartile 75% (IQ3) | 100.0% | 88.3% |
| Interquartile Range (IQR) | 18.0% | 8.0% |
| Standard Deviation (Sample) | 10.5% | 14.8% |
| Standard Deviation (Population) | 10.4% | 14.7% |
Similar Demographics by In Labor Force | Age 30-34
Demographics Similar to Icelanders by In Labor Force | Age 30-34
In terms of in labor force | age 30-34, the demographic groups most similar to Icelanders are Immigrants from Uruguay (84.7%, a difference of 0.0%), Immigrants from Western Europe (84.7%, a difference of 0.0%), South American (84.7%, a difference of 0.010%), Afghan (84.7%, a difference of 0.010%), and Immigrants from South Eastern Asia (84.7%, a difference of 0.020%).
| Demographics | Rating | Rank | In Labor Force | Age 30-34 |
| Peruvians | 65.9 /100 | #157 | Good 84.8% |
| Immigrants | Armenia | 64.7 /100 | #158 | Good 84.8% |
| Czechoslovakians | 63.0 /100 | #159 | Good 84.8% |
| Pakistanis | 60.8 /100 | #160 | Good 84.7% |
| Immigrants | Cambodia | 60.7 /100 | #161 | Good 84.7% |
| South Americans | 58.7 /100 | #162 | Average 84.7% |
| Immigrants | Uruguay | 57.4 /100 | #163 | Average 84.7% |
| Icelanders | 56.8 /100 | #164 | Average 84.7% |
| Immigrants | Western Europe | 56.7 /100 | #165 | Average 84.7% |
| Afghans | 55.2 /100 | #166 | Average 84.7% |
| Immigrants | South Eastern Asia | 54.2 /100 | #167 | Average 84.7% |
| Immigrants | Peru | 52.4 /100 | #168 | Average 84.7% |
| South American Indians | 52.1 /100 | #169 | Average 84.7% |
| Immigrants | Burma/Myanmar | 52.0 /100 | #170 | Average 84.7% |
| Irish | 52.0 /100 | #171 | Average 84.7% |
Demographics Similar to Immigrants from Indonesia by In Labor Force | Age 30-34
In terms of in labor force | age 30-34, the demographic groups most similar to Immigrants from Indonesia are Chilean (84.9%, a difference of 0.010%), Immigrants from Vietnam (85.0%, a difference of 0.030%), Colombian (84.9%, a difference of 0.030%), South African (85.0%, a difference of 0.050%), and Sri Lankan (85.0%, a difference of 0.050%).
| Demographics | Rating | Rank | In Labor Force | Age 30-34 |
| Immigrants | Asia | 88.9 /100 | #135 | Excellent 85.0% |
| Jordanians | 88.6 /100 | #136 | Excellent 85.0% |
| South Africans | 88.0 /100 | #137 | Excellent 85.0% |
| Sri Lankans | 87.8 /100 | #138 | Excellent 85.0% |
| Bhutanese | 87.5 /100 | #139 | Excellent 85.0% |
| Immigrants | Vietnam | 86.5 /100 | #140 | Excellent 85.0% |
| Chileans | 85.3 /100 | #141 | Excellent 84.9% |
| Immigrants | Indonesia | 84.3 /100 | #142 | Excellent 84.9% |
| Colombians | 82.2 /100 | #143 | Excellent 84.9% |
| Uruguayans | 78.5 /100 | #144 | Good 84.9% |
| Palestinians | 77.7 /100 | #145 | Good 84.9% |
| Immigrants | Saudi Arabia | 76.6 /100 | #146 | Good 84.9% |
| Immigrants | Colombia | 76.3 /100 | #147 | Good 84.9% |
| Immigrants | Pakistan | 76.2 /100 | #148 | Good 84.9% |
| Immigrants | Ukraine | 75.1 /100 | #149 | Good 84.8% |