Armenian vs Immigrants from Indonesia In Labor Force | Age 30-34
COMPARE
Armenian
Immigrants from Indonesia
In Labor Force | Age 30-34
In Labor Force | Age 30-34 Comparison
Armenians
Immigrants from Indonesia
85.0%
IN LABOR FORCE | AGE 30-34
92.2/ 100
METRIC RATING
123rd/ 347
METRIC RANK
84.9%
IN LABOR FORCE | AGE 30-34
84.3/ 100
METRIC RATING
142nd/ 347
METRIC RANK
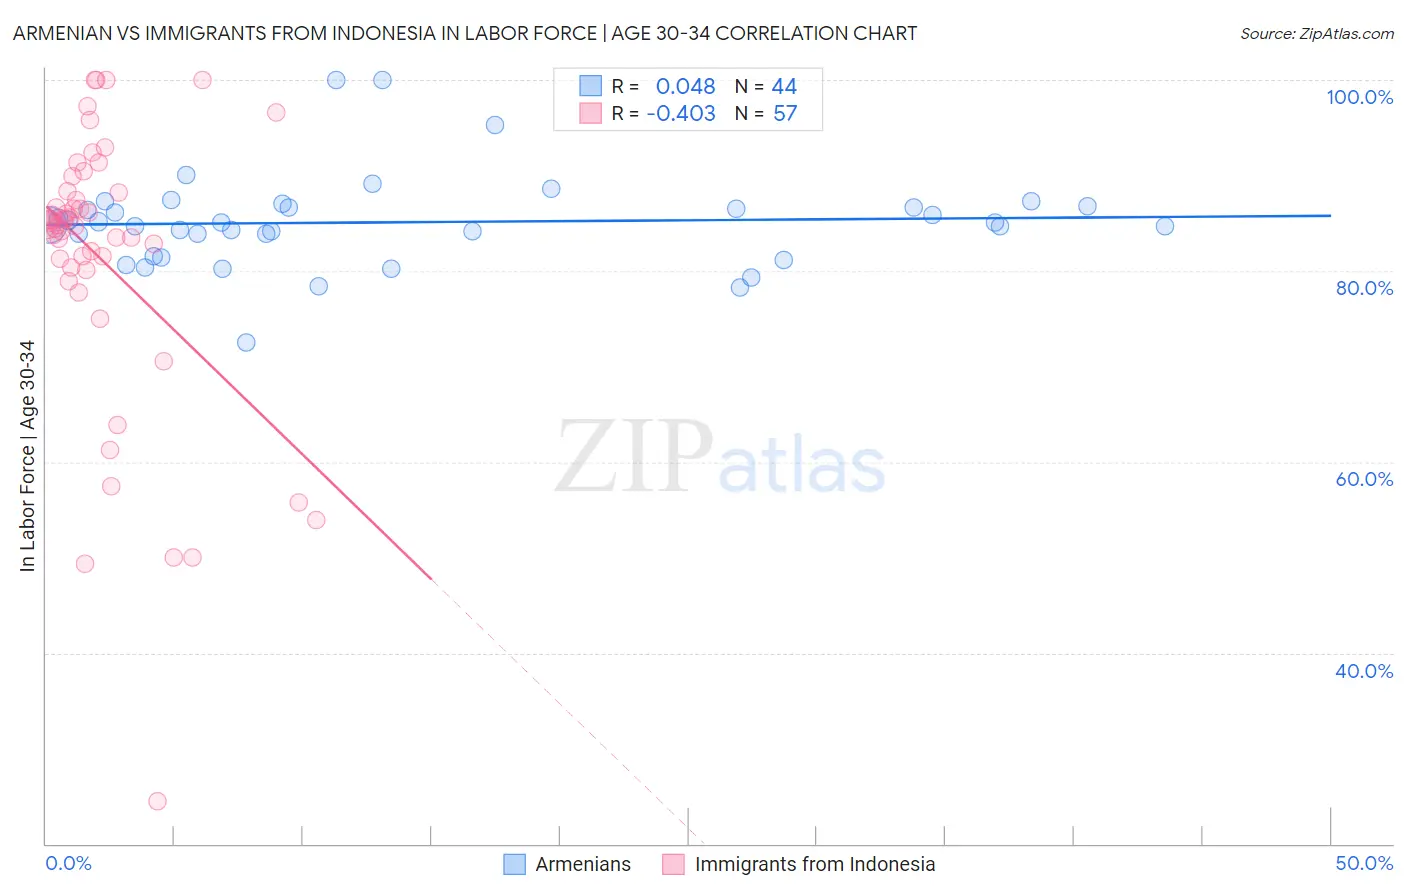
Armenian vs Immigrants from Indonesia In Labor Force | Age 30-34 Correlation Chart
The statistical analysis conducted on geographies consisting of 310,746,889 people shows no correlation between the proportion of Armenians and labor force participation rate among population between the ages 30 and 34 in the United States with a correlation coefficient (R) of 0.048 and weighted average of 85.0%. Similarly, the statistical analysis conducted on geographies consisting of 215,722,421 people shows a moderate negative correlation between the proportion of Immigrants from Indonesia and labor force participation rate among population between the ages 30 and 34 in the United States with a correlation coefficient (R) of -0.403 and weighted average of 84.9%, a difference of 0.14%.
In Labor Force | Age 30-34 Correlation Summary
| Measurement | Armenian | Immigrants from Indonesia |
| Minimum | 72.5% | 24.5% |
| Maximum | 100.0% | 100.0% |
| Range | 27.5% | 75.5% |
| Mean | 85.1% | 81.2% |
| Median | 84.9% | 84.8% |
| Interquartile 25% (IQ1) | 82.7% | 80.3% |
| Interquartile 75% (IQ3) | 86.8% | 88.3% |
| Interquartile Range (IQR) | 4.1% | 8.0% |
| Standard Deviation (Sample) | 5.0% | 14.8% |
| Standard Deviation (Population) | 4.9% | 14.7% |
Demographics Similar to Armenians and Immigrants from Indonesia by In Labor Force | Age 30-34
In terms of in labor force | age 30-34, the demographic groups most similar to Armenians are Australian (85.0%, a difference of 0.0%), Immigrants from Kuwait (85.1%, a difference of 0.010%), Immigrants from Jordan (85.0%, a difference of 0.020%), Austrian (85.0%, a difference of 0.030%), and Slavic (85.0%, a difference of 0.030%). Similarly, the demographic groups most similar to Immigrants from Indonesia are Chilean (84.9%, a difference of 0.010%), Immigrants from Vietnam (85.0%, a difference of 0.030%), South African (85.0%, a difference of 0.050%), Sri Lankan (85.0%, a difference of 0.050%), and Bhutanese (85.0%, a difference of 0.050%).
| Demographics | Rating | Rank | In Labor Force | Age 30-34 |
| Immigrants | Kuwait | 92.6 /100 | #122 | Exceptional 85.1% |
| Armenians | 92.2 /100 | #123 | Exceptional 85.0% |
| Australians | 92.0 /100 | #124 | Exceptional 85.0% |
| Immigrants | Jordan | 91.5 /100 | #125 | Exceptional 85.0% |
| Austrians | 90.9 /100 | #126 | Exceptional 85.0% |
| Slavs | 90.7 /100 | #127 | Exceptional 85.0% |
| Immigrants | Argentina | 90.6 /100 | #128 | Exceptional 85.0% |
| Immigrants | Western Africa | 90.2 /100 | #129 | Exceptional 85.0% |
| Immigrants | Spain | 90.0 /100 | #130 | Exceptional 85.0% |
| Chinese | 89.6 /100 | #131 | Excellent 85.0% |
| Immigrants | Israel | 89.5 /100 | #132 | Excellent 85.0% |
| New Zealanders | 89.5 /100 | #133 | Excellent 85.0% |
| Immigrants | Chile | 89.2 /100 | #134 | Excellent 85.0% |
| Immigrants | Asia | 88.9 /100 | #135 | Excellent 85.0% |
| Jordanians | 88.6 /100 | #136 | Excellent 85.0% |
| South Africans | 88.0 /100 | #137 | Excellent 85.0% |
| Sri Lankans | 87.8 /100 | #138 | Excellent 85.0% |
| Bhutanese | 87.5 /100 | #139 | Excellent 85.0% |
| Immigrants | Vietnam | 86.5 /100 | #140 | Excellent 85.0% |
| Chileans | 85.3 /100 | #141 | Excellent 84.9% |
| Immigrants | Indonesia | 84.3 /100 | #142 | Excellent 84.9% |