Sudanese vs Immigrants from Nicaragua In Labor Force | Age 30-34
COMPARE
Sudanese
Immigrants from Nicaragua
In Labor Force | Age 30-34
In Labor Force | Age 30-34 Comparison
Sudanese
Immigrants from Nicaragua
85.2%
IN LABOR FORCE | AGE 30-34
97.1/ 100
METRIC RATING
100th/ 347
METRIC RANK
83.9%
IN LABOR FORCE | AGE 30-34
0.6/ 100
METRIC RATING
253rd/ 347
METRIC RANK
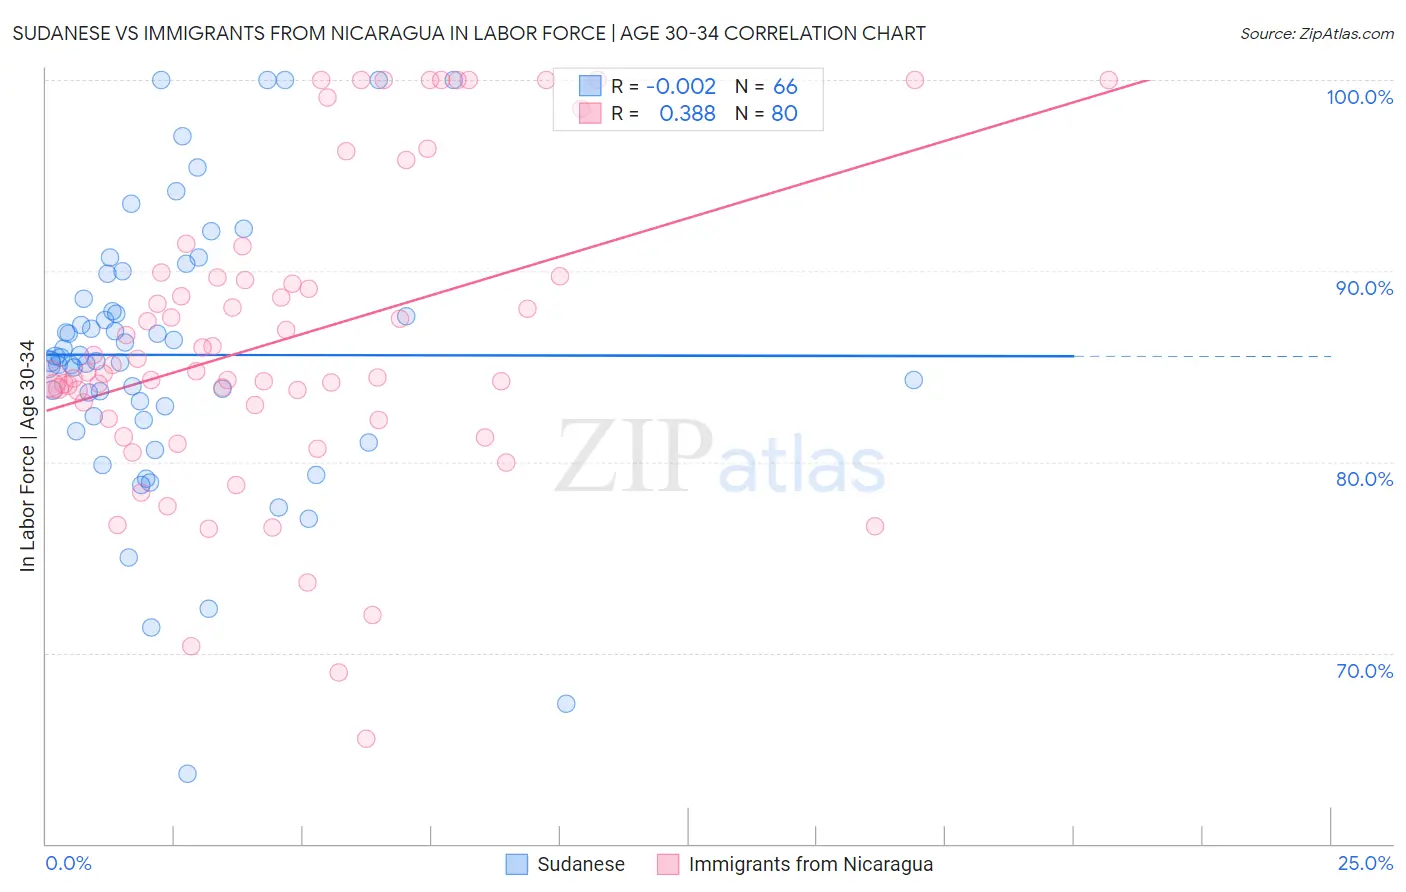
Sudanese vs Immigrants from Nicaragua In Labor Force | Age 30-34 Correlation Chart
The statistical analysis conducted on geographies consisting of 110,111,574 people shows no correlation between the proportion of Sudanese and labor force participation rate among population between the ages 30 and 34 in the United States with a correlation coefficient (R) of -0.002 and weighted average of 85.2%. Similarly, the statistical analysis conducted on geographies consisting of 236,321,659 people shows a mild positive correlation between the proportion of Immigrants from Nicaragua and labor force participation rate among population between the ages 30 and 34 in the United States with a correlation coefficient (R) of 0.388 and weighted average of 83.9%, a difference of 1.5%.
In Labor Force | Age 30-34 Correlation Summary
| Measurement | Sudanese | Immigrants from Nicaragua |
| Minimum | 63.7% | 65.5% |
| Maximum | 100.0% | 100.0% |
| Range | 36.3% | 34.5% |
| Mean | 85.6% | 86.5% |
| Median | 85.4% | 84.7% |
| Interquartile 25% (IQ1) | 82.4% | 82.6% |
| Interquartile 75% (IQ3) | 88.5% | 89.7% |
| Interquartile Range (IQR) | 6.1% | 7.1% |
| Standard Deviation (Sample) | 7.2% | 8.0% |
| Standard Deviation (Population) | 7.2% | 7.9% |
Similar Demographics by In Labor Force | Age 30-34
Demographics Similar to Sudanese by In Labor Force | Age 30-34
In terms of in labor force | age 30-34, the demographic groups most similar to Sudanese are Belgian (85.2%, a difference of 0.0%), Immigrants from Korea (85.2%, a difference of 0.010%), Thai (85.2%, a difference of 0.010%), Immigrants from Uganda (85.2%, a difference of 0.010%), and Immigrants from Belarus (85.2%, a difference of 0.010%).
| Demographics | Rating | Rank | In Labor Force | Age 30-34 |
| Immigrants | Norway | 97.6 /100 | #93 | Exceptional 85.2% |
| Swedes | 97.5 /100 | #94 | Exceptional 85.2% |
| Immigrants | India | 97.4 /100 | #95 | Exceptional 85.2% |
| Immigrants | Korea | 97.3 /100 | #96 | Exceptional 85.2% |
| Thais | 97.2 /100 | #97 | Exceptional 85.2% |
| Immigrants | Uganda | 97.2 /100 | #98 | Exceptional 85.2% |
| Belgians | 97.2 /100 | #99 | Exceptional 85.2% |
| Sudanese | 97.1 /100 | #100 | Exceptional 85.2% |
| Immigrants | Belarus | 96.9 /100 | #101 | Exceptional 85.2% |
| Immigrants | Austria | 96.8 /100 | #102 | Exceptional 85.2% |
| Ukrainians | 96.6 /100 | #103 | Exceptional 85.2% |
| Immigrants | Ghana | 96.5 /100 | #104 | Exceptional 85.2% |
| Alsatians | 96.3 /100 | #105 | Exceptional 85.2% |
| Immigrants | Middle Africa | 96.3 /100 | #106 | Exceptional 85.2% |
| Immigrants | Northern Africa | 96.3 /100 | #107 | Exceptional 85.2% |
Demographics Similar to Immigrants from Nicaragua by In Labor Force | Age 30-34
In terms of in labor force | age 30-34, the demographic groups most similar to Immigrants from Nicaragua are Bahamian (83.9%, a difference of 0.0%), Nicaraguan (83.9%, a difference of 0.010%), Immigrants from Iraq (83.9%, a difference of 0.020%), Immigrants from St. Vincent and the Grenadines (83.9%, a difference of 0.020%), and Immigrants from Dominica (84.0%, a difference of 0.040%).
| Demographics | Rating | Rank | In Labor Force | Age 30-34 |
| Central Americans | 0.9 /100 | #246 | Tragic 84.0% |
| British West Indians | 0.8 /100 | #247 | Tragic 84.0% |
| Portuguese | 0.8 /100 | #248 | Tragic 84.0% |
| Immigrants | Dominica | 0.7 /100 | #249 | Tragic 84.0% |
| Immigrants | Iraq | 0.7 /100 | #250 | Tragic 83.9% |
| Nicaraguans | 0.6 /100 | #251 | Tragic 83.9% |
| Bahamians | 0.6 /100 | #252 | Tragic 83.9% |
| Immigrants | Nicaragua | 0.6 /100 | #253 | Tragic 83.9% |
| Immigrants | St. Vincent and the Grenadines | 0.5 /100 | #254 | Tragic 83.9% |
| Whites/Caucasians | 0.5 /100 | #255 | Tragic 83.9% |
| Immigrants | Lebanon | 0.4 /100 | #256 | Tragic 83.9% |
| Iraqis | 0.3 /100 | #257 | Tragic 83.8% |
| Hondurans | 0.3 /100 | #258 | Tragic 83.8% |
| Scotch-Irish | 0.3 /100 | #259 | Tragic 83.8% |
| Immigrants | Dominican Republic | 0.3 /100 | #260 | Tragic 83.8% |