Sudanese vs Somali In Labor Force | Age 30-34
COMPARE
Sudanese
Somali
In Labor Force | Age 30-34
In Labor Force | Age 30-34 Comparison
Sudanese
Somalis
85.2%
IN LABOR FORCE | AGE 30-34
97.1/ 100
METRIC RATING
100th/ 347
METRIC RANK
86.2%
IN LABOR FORCE | AGE 30-34
100.0/ 100
METRIC RATING
6th/ 347
METRIC RANK
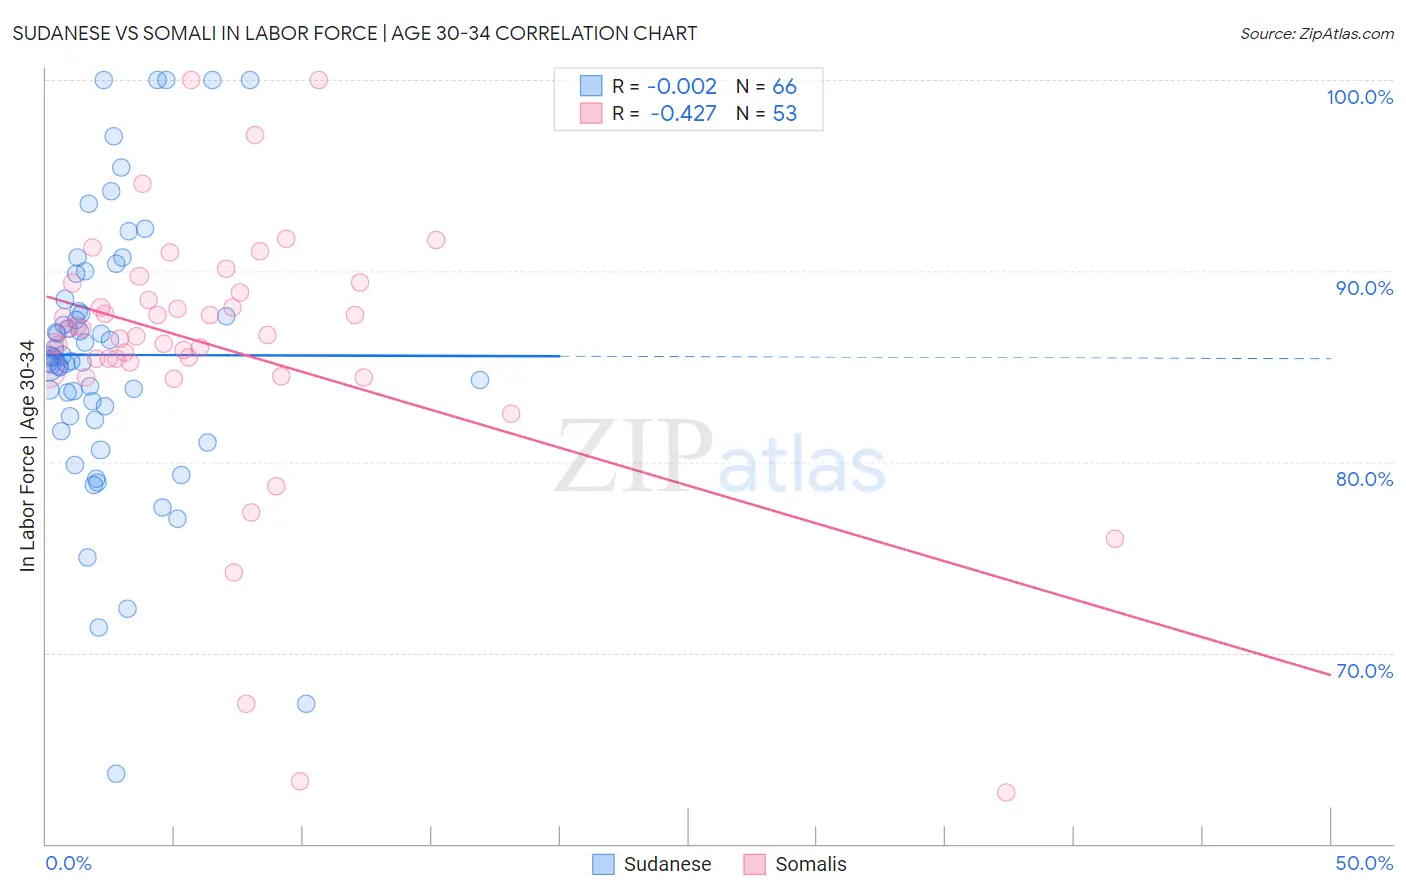
Sudanese vs Somali In Labor Force | Age 30-34 Correlation Chart
The statistical analysis conducted on geographies consisting of 110,111,574 people shows no correlation between the proportion of Sudanese and labor force participation rate among population between the ages 30 and 34 in the United States with a correlation coefficient (R) of -0.002 and weighted average of 85.2%. Similarly, the statistical analysis conducted on geographies consisting of 99,305,545 people shows a moderate negative correlation between the proportion of Somalis and labor force participation rate among population between the ages 30 and 34 in the United States with a correlation coefficient (R) of -0.427 and weighted average of 86.2%, a difference of 1.2%.
In Labor Force | Age 30-34 Correlation Summary
| Measurement | Sudanese | Somali |
| Minimum | 63.7% | 62.7% |
| Maximum | 100.0% | 100.0% |
| Range | 36.3% | 37.3% |
| Mean | 85.6% | 85.9% |
| Median | 85.4% | 86.6% |
| Interquartile 25% (IQ1) | 82.4% | 85.0% |
| Interquartile 75% (IQ3) | 88.5% | 89.1% |
| Interquartile Range (IQR) | 6.1% | 4.1% |
| Standard Deviation (Sample) | 7.2% | 7.1% |
| Standard Deviation (Population) | 7.2% | 7.0% |
Similar Demographics by In Labor Force | Age 30-34
Demographics Similar to Sudanese by In Labor Force | Age 30-34
In terms of in labor force | age 30-34, the demographic groups most similar to Sudanese are Belgian (85.2%, a difference of 0.0%), Immigrants from Korea (85.2%, a difference of 0.010%), Thai (85.2%, a difference of 0.010%), Immigrants from Uganda (85.2%, a difference of 0.010%), and Immigrants from Belarus (85.2%, a difference of 0.010%).
| Demographics | Rating | Rank | In Labor Force | Age 30-34 |
| Immigrants | Norway | 97.6 /100 | #93 | Exceptional 85.2% |
| Swedes | 97.5 /100 | #94 | Exceptional 85.2% |
| Immigrants | India | 97.4 /100 | #95 | Exceptional 85.2% |
| Immigrants | Korea | 97.3 /100 | #96 | Exceptional 85.2% |
| Thais | 97.2 /100 | #97 | Exceptional 85.2% |
| Immigrants | Uganda | 97.2 /100 | #98 | Exceptional 85.2% |
| Belgians | 97.2 /100 | #99 | Exceptional 85.2% |
| Sudanese | 97.1 /100 | #100 | Exceptional 85.2% |
| Immigrants | Belarus | 96.9 /100 | #101 | Exceptional 85.2% |
| Immigrants | Austria | 96.8 /100 | #102 | Exceptional 85.2% |
| Ukrainians | 96.6 /100 | #103 | Exceptional 85.2% |
| Immigrants | Ghana | 96.5 /100 | #104 | Exceptional 85.2% |
| Alsatians | 96.3 /100 | #105 | Exceptional 85.2% |
| Immigrants | Middle Africa | 96.3 /100 | #106 | Exceptional 85.2% |
| Immigrants | Northern Africa | 96.3 /100 | #107 | Exceptional 85.2% |
Demographics Similar to Somalis by In Labor Force | Age 30-34
In terms of in labor force | age 30-34, the demographic groups most similar to Somalis are Immigrants from Bolivia (86.2%, a difference of 0.010%), Cambodian (86.2%, a difference of 0.020%), Immigrants from Ireland (86.3%, a difference of 0.030%), Immigrants from Somalia (86.2%, a difference of 0.040%), and Immigrants from Serbia (86.2%, a difference of 0.070%).
| Demographics | Rating | Rank | In Labor Force | Age 30-34 |
| Luxembourgers | 100.0 /100 | #1 | Exceptional 86.6% |
| Ethiopians | 100.0 /100 | #2 | Exceptional 86.6% |
| Immigrants | Ethiopia | 100.0 /100 | #3 | Exceptional 86.6% |
| Liberians | 100.0 /100 | #4 | Exceptional 86.4% |
| Immigrants | Ireland | 100.0 /100 | #5 | Exceptional 86.3% |
| Somalis | 100.0 /100 | #6 | Exceptional 86.2% |
| Immigrants | Bolivia | 100.0 /100 | #7 | Exceptional 86.2% |
| Cambodians | 100.0 /100 | #8 | Exceptional 86.2% |
| Immigrants | Somalia | 100.0 /100 | #9 | Exceptional 86.2% |
| Immigrants | Serbia | 100.0 /100 | #10 | Exceptional 86.2% |
| Carpatho Rusyns | 100.0 /100 | #11 | Exceptional 86.2% |
| Bolivians | 100.0 /100 | #12 | Exceptional 86.1% |
| Immigrants | Croatia | 100.0 /100 | #13 | Exceptional 86.1% |
| Immigrants | Cabo Verde | 100.0 /100 | #14 | Exceptional 86.1% |
| Immigrants | Albania | 100.0 /100 | #15 | Exceptional 86.1% |