Immigrants from Armenia vs Immigrants from Indonesia In Labor Force | Age 30-34
COMPARE
Immigrants from Armenia
Immigrants from Indonesia
In Labor Force | Age 30-34
In Labor Force | Age 30-34 Comparison
Immigrants from Armenia
Immigrants from Indonesia
84.8%
IN LABOR FORCE | AGE 30-34
64.7/ 100
METRIC RATING
158th/ 347
METRIC RANK
84.9%
IN LABOR FORCE | AGE 30-34
84.3/ 100
METRIC RATING
142nd/ 347
METRIC RANK
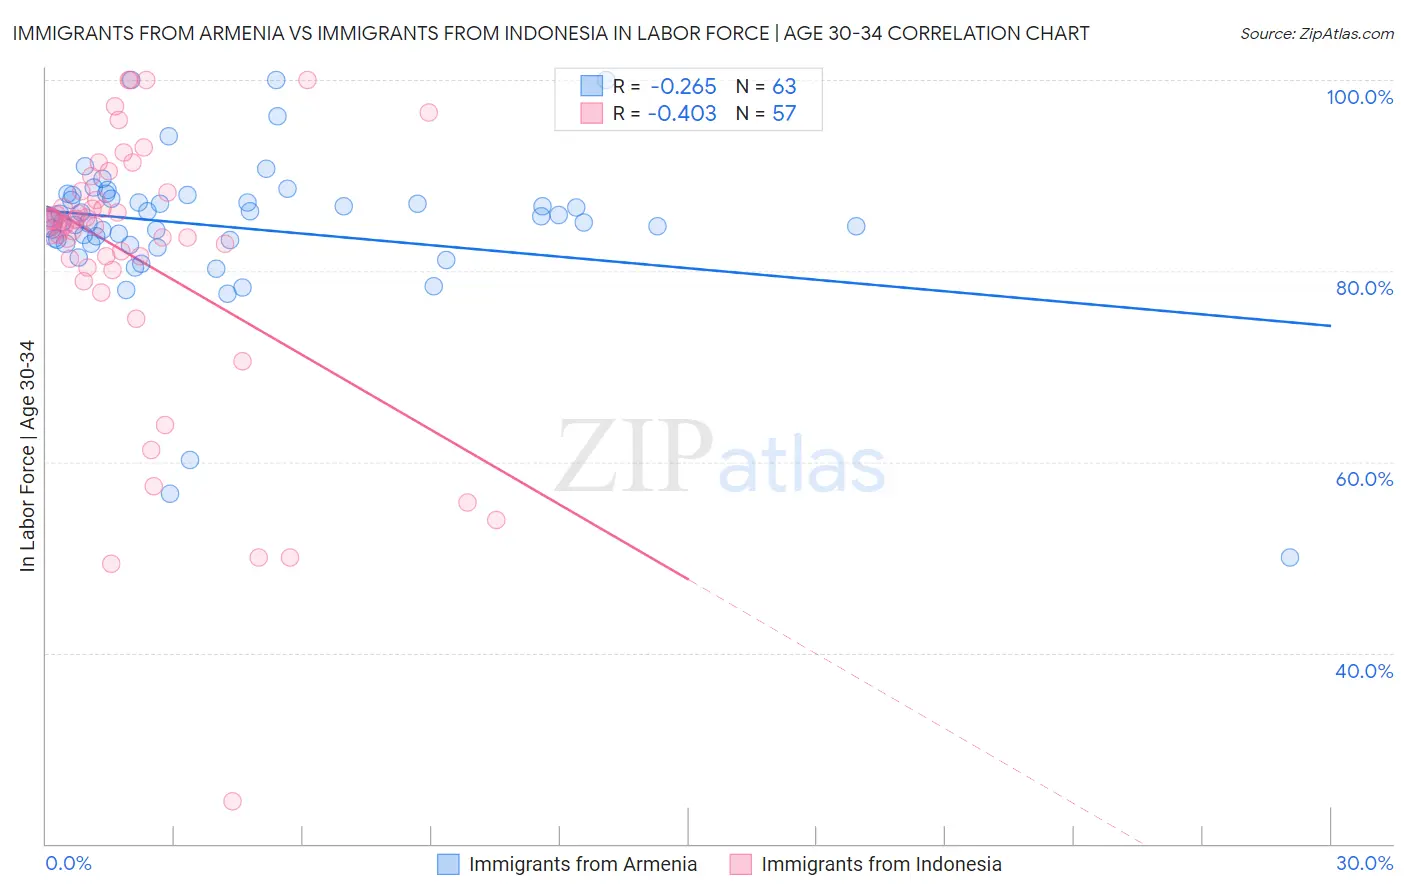
Immigrants from Armenia vs Immigrants from Indonesia In Labor Force | Age 30-34 Correlation Chart
The statistical analysis conducted on geographies consisting of 97,710,300 people shows a weak negative correlation between the proportion of Immigrants from Armenia and labor force participation rate among population between the ages 30 and 34 in the United States with a correlation coefficient (R) of -0.265 and weighted average of 84.8%. Similarly, the statistical analysis conducted on geographies consisting of 215,722,421 people shows a moderate negative correlation between the proportion of Immigrants from Indonesia and labor force participation rate among population between the ages 30 and 34 in the United States with a correlation coefficient (R) of -0.403 and weighted average of 84.9%, a difference of 0.19%.
In Labor Force | Age 30-34 Correlation Summary
| Measurement | Immigrants from Armenia | Immigrants from Indonesia |
| Minimum | 50.0% | 24.5% |
| Maximum | 100.0% | 100.0% |
| Range | 50.0% | 75.5% |
| Mean | 84.6% | 81.2% |
| Median | 85.2% | 84.8% |
| Interquartile 25% (IQ1) | 82.9% | 80.3% |
| Interquartile 75% (IQ3) | 87.5% | 88.3% |
| Interquartile Range (IQR) | 4.6% | 8.0% |
| Standard Deviation (Sample) | 8.1% | 14.8% |
| Standard Deviation (Population) | 8.0% | 14.7% |
Demographics Similar to Immigrants from Armenia and Immigrants from Indonesia by In Labor Force | Age 30-34
In terms of in labor force | age 30-34, the demographic groups most similar to Immigrants from Armenia are Peruvian (84.8%, a difference of 0.010%), Czechoslovakian (84.8%, a difference of 0.010%), French Canadian (84.8%, a difference of 0.020%), Pakistani (84.7%, a difference of 0.030%), and Syrian (84.8%, a difference of 0.040%). Similarly, the demographic groups most similar to Immigrants from Indonesia are Chilean (84.9%, a difference of 0.010%), Immigrants from Vietnam (85.0%, a difference of 0.030%), Colombian (84.9%, a difference of 0.030%), Uruguayan (84.9%, a difference of 0.070%), and Palestinian (84.9%, a difference of 0.080%).
| Demographics | Rating | Rank | In Labor Force | Age 30-34 |
| Immigrants | Vietnam | 86.5 /100 | #140 | Excellent 85.0% |
| Chileans | 85.3 /100 | #141 | Excellent 84.9% |
| Immigrants | Indonesia | 84.3 /100 | #142 | Excellent 84.9% |
| Colombians | 82.2 /100 | #143 | Excellent 84.9% |
| Uruguayans | 78.5 /100 | #144 | Good 84.9% |
| Palestinians | 77.7 /100 | #145 | Good 84.9% |
| Immigrants | Saudi Arabia | 76.6 /100 | #146 | Good 84.9% |
| Immigrants | Colombia | 76.3 /100 | #147 | Good 84.9% |
| Immigrants | Pakistan | 76.2 /100 | #148 | Good 84.9% |
| Immigrants | Ukraine | 75.1 /100 | #149 | Good 84.8% |
| Germans | 75.1 /100 | #150 | Good 84.8% |
| Immigrants | Senegal | 74.0 /100 | #151 | Good 84.8% |
| Romanians | 73.5 /100 | #152 | Good 84.8% |
| Syrians | 70.1 /100 | #153 | Good 84.8% |
| Northern Europeans | 70.0 /100 | #154 | Good 84.8% |
| Immigrants | Sudan | 69.5 /100 | #155 | Good 84.8% |
| French Canadians | 67.3 /100 | #156 | Good 84.8% |
| Peruvians | 65.9 /100 | #157 | Good 84.8% |
| Immigrants | Armenia | 64.7 /100 | #158 | Good 84.8% |
| Czechoslovakians | 63.0 /100 | #159 | Good 84.8% |
| Pakistanis | 60.8 /100 | #160 | Good 84.7% |