Sudanese vs Immigrants from Zimbabwe In Labor Force | Age > 16
COMPARE
Sudanese
Immigrants from Zimbabwe
In Labor Force | Age > 16
In Labor Force | Age > 16 Comparison
Sudanese
Immigrants from Zimbabwe
68.0%
IN LABOR FORCE | AGE > 16
100.0/ 100
METRIC RATING
12th/ 347
METRIC RANK
66.8%
IN LABOR FORCE | AGE > 16
100.0/ 100
METRIC RATING
41st/ 347
METRIC RANK
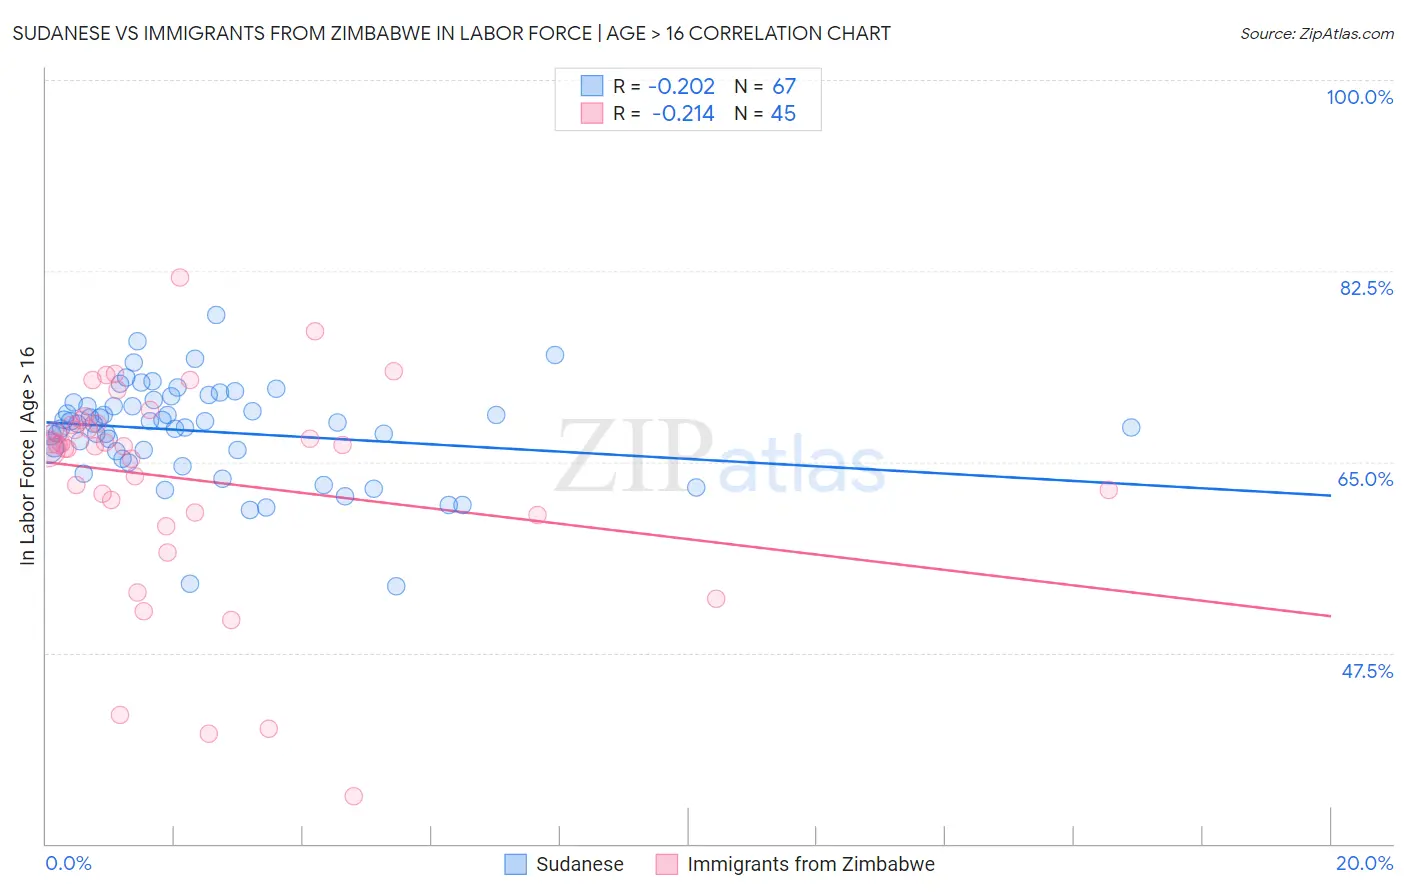
Sudanese vs Immigrants from Zimbabwe In Labor Force | Age > 16 Correlation Chart
The statistical analysis conducted on geographies consisting of 110,150,876 people shows a weak negative correlation between the proportion of Sudanese and labor force participation rate among population ages 16 and over in the United States with a correlation coefficient (R) of -0.202 and weighted average of 68.0%. Similarly, the statistical analysis conducted on geographies consisting of 117,813,757 people shows a weak negative correlation between the proportion of Immigrants from Zimbabwe and labor force participation rate among population ages 16 and over in the United States with a correlation coefficient (R) of -0.214 and weighted average of 66.8%, a difference of 1.8%.
In Labor Force | Age > 16 Correlation Summary
| Measurement | Sudanese | Immigrants from Zimbabwe |
| Minimum | 53.6% | 34.4% |
| Maximum | 78.4% | 81.9% |
| Range | 24.8% | 47.5% |
| Mean | 67.8% | 63.4% |
| Median | 68.5% | 66.5% |
| Interquartile 25% (IQ1) | 65.9% | 60.2% |
| Interquartile 75% (IQ3) | 70.4% | 68.7% |
| Interquartile Range (IQR) | 4.5% | 8.5% |
| Standard Deviation (Sample) | 4.5% | 10.0% |
| Standard Deviation (Population) | 4.5% | 9.9% |
Similar Demographics by In Labor Force | Age > 16
Demographics Similar to Sudanese by In Labor Force | Age > 16
In terms of in labor force | age > 16, the demographic groups most similar to Sudanese are Immigrants from Nepal (68.0%, a difference of 0.020%), Bolivian (68.2%, a difference of 0.22%), Liberian (67.8%, a difference of 0.38%), Immigrants from Middle Africa (67.7%, a difference of 0.44%), and Immigrants from Sudan (67.7%, a difference of 0.54%).
| Demographics | Rating | Rank | In Labor Force | Age > 16 |
| Sierra Leoneans | 100.0 /100 | #5 | Exceptional 68.9% |
| Immigrants | Eritrea | 100.0 /100 | #6 | Exceptional 68.9% |
| Immigrants | Cameroon | 100.0 /100 | #7 | Exceptional 68.7% |
| Immigrants | Sierra Leone | 100.0 /100 | #8 | Exceptional 68.5% |
| Immigrants | Eastern Africa | 100.0 /100 | #9 | Exceptional 68.5% |
| Immigrants | Bolivia | 100.0 /100 | #10 | Exceptional 68.4% |
| Bolivians | 100.0 /100 | #11 | Exceptional 68.2% |
| Sudanese | 100.0 /100 | #12 | Exceptional 68.0% |
| Immigrants | Nepal | 100.0 /100 | #13 | Exceptional 68.0% |
| Liberians | 100.0 /100 | #14 | Exceptional 67.8% |
| Immigrants | Middle Africa | 100.0 /100 | #15 | Exceptional 67.7% |
| Immigrants | Sudan | 100.0 /100 | #16 | Exceptional 67.7% |
| Immigrants | India | 100.0 /100 | #17 | Exceptional 67.6% |
| Immigrants | Liberia | 100.0 /100 | #18 | Exceptional 67.6% |
| Kenyans | 100.0 /100 | #19 | Exceptional 67.6% |
Demographics Similar to Immigrants from Zimbabwe by In Labor Force | Age > 16
In terms of in labor force | age > 16, the demographic groups most similar to Immigrants from Zimbabwe are Immigrants from El Salvador (66.8%, a difference of 0.0%), Salvadoran (66.8%, a difference of 0.020%), Senegalese (66.7%, a difference of 0.10%), Luxembourger (66.7%, a difference of 0.12%), and Immigrants from Nigeria (66.9%, a difference of 0.17%).
| Demographics | Rating | Rank | In Labor Force | Age > 16 |
| Immigrants | Ghana | 100.0 /100 | #34 | Exceptional 67.1% |
| Immigrants | South Central Asia | 100.0 /100 | #35 | Exceptional 67.1% |
| Immigrants | Western Africa | 100.0 /100 | #36 | Exceptional 67.1% |
| Immigrants | Afghanistan | 100.0 /100 | #37 | Exceptional 67.0% |
| Immigrants | Nigeria | 100.0 /100 | #38 | Exceptional 66.9% |
| Salvadorans | 100.0 /100 | #39 | Exceptional 66.8% |
| Immigrants | El Salvador | 100.0 /100 | #40 | Exceptional 66.8% |
| Immigrants | Zimbabwe | 100.0 /100 | #41 | Exceptional 66.8% |
| Senegalese | 100.0 /100 | #42 | Exceptional 66.7% |
| Luxembourgers | 100.0 /100 | #43 | Exceptional 66.7% |
| Immigrants | Pakistan | 100.0 /100 | #44 | Exceptional 66.7% |
| Immigrants | Brazil | 100.0 /100 | #45 | Exceptional 66.7% |
| Brazilians | 100.0 /100 | #46 | Exceptional 66.6% |
| Immigrants | Bulgaria | 100.0 /100 | #47 | Exceptional 66.6% |
| Nigerians | 100.0 /100 | #48 | Exceptional 66.6% |