Sudanese vs Trinidadian and Tobagonian In Labor Force | Age > 16
COMPARE
Sudanese
Trinidadian and Tobagonian
In Labor Force | Age > 16
In Labor Force | Age > 16 Comparison
Sudanese
Trinidadians and Tobagonians
68.0%
IN LABOR FORCE | AGE > 16
100.0/ 100
METRIC RATING
12th/ 347
METRIC RANK
65.1%
IN LABOR FORCE | AGE > 16
45.2/ 100
METRIC RATING
178th/ 347
METRIC RANK
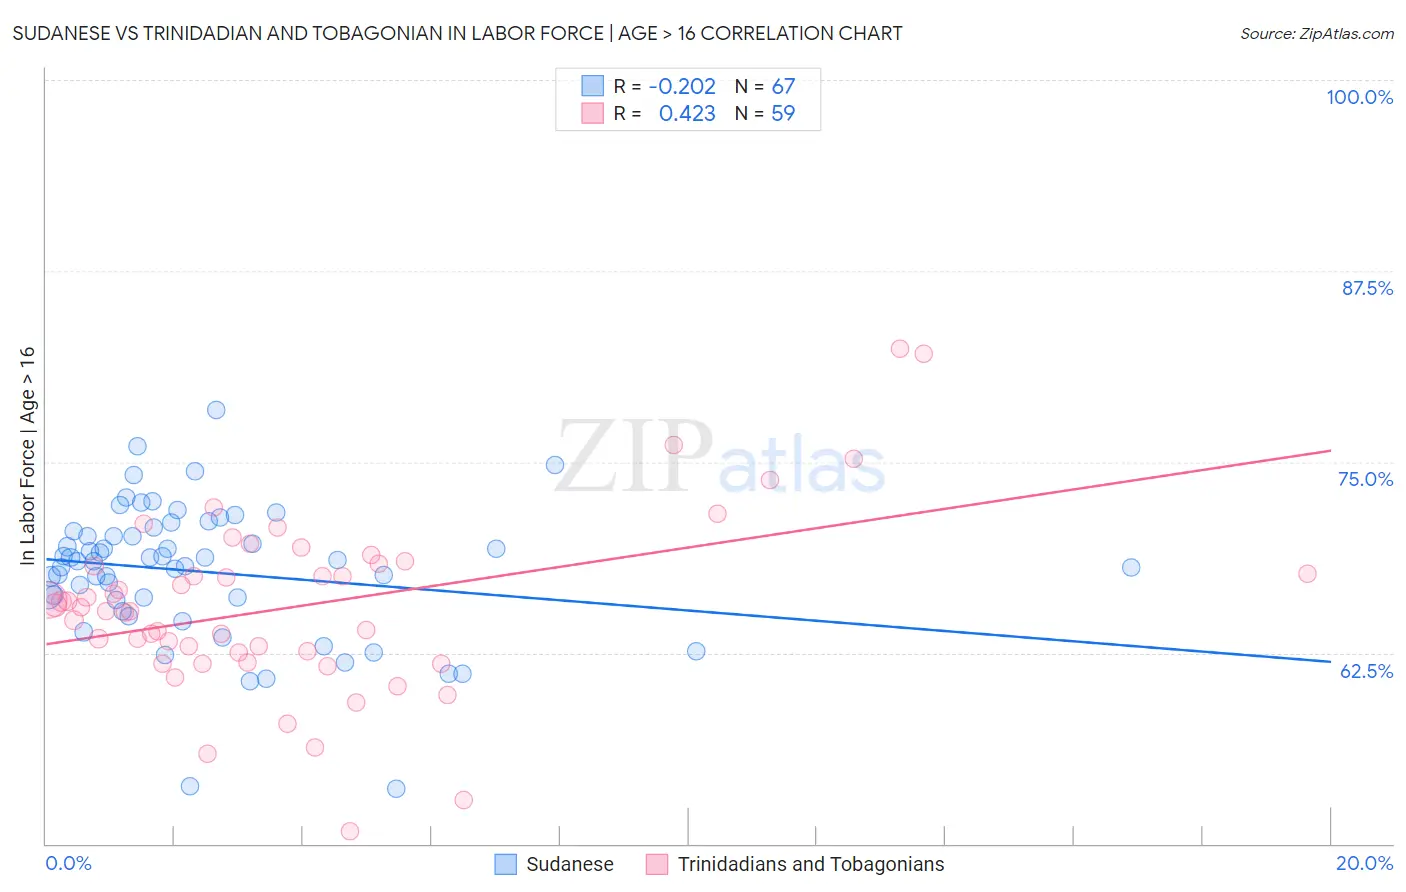
Sudanese vs Trinidadian and Tobagonian In Labor Force | Age > 16 Correlation Chart
The statistical analysis conducted on geographies consisting of 110,150,876 people shows a weak negative correlation between the proportion of Sudanese and labor force participation rate among population ages 16 and over in the United States with a correlation coefficient (R) of -0.202 and weighted average of 68.0%. Similarly, the statistical analysis conducted on geographies consisting of 219,884,780 people shows a moderate positive correlation between the proportion of Trinidadians and Tobagonians and labor force participation rate among population ages 16 and over in the United States with a correlation coefficient (R) of 0.423 and weighted average of 65.1%, a difference of 4.5%.
In Labor Force | Age > 16 Correlation Summary
| Measurement | Sudanese | Trinidadian and Tobagonian |
| Minimum | 53.6% | 50.8% |
| Maximum | 78.4% | 82.4% |
| Range | 24.8% | 31.6% |
| Mean | 67.8% | 65.6% |
| Median | 68.5% | 65.5% |
| Interquartile 25% (IQ1) | 65.9% | 62.5% |
| Interquartile 75% (IQ3) | 70.4% | 68.3% |
| Interquartile Range (IQR) | 4.5% | 5.8% |
| Standard Deviation (Sample) | 4.5% | 5.8% |
| Standard Deviation (Population) | 4.5% | 5.7% |
Similar Demographics by In Labor Force | Age > 16
Demographics Similar to Sudanese by In Labor Force | Age > 16
In terms of in labor force | age > 16, the demographic groups most similar to Sudanese are Immigrants from Nepal (68.0%, a difference of 0.020%), Bolivian (68.2%, a difference of 0.22%), Liberian (67.8%, a difference of 0.38%), Immigrants from Middle Africa (67.7%, a difference of 0.44%), and Immigrants from Sudan (67.7%, a difference of 0.54%).
| Demographics | Rating | Rank | In Labor Force | Age > 16 |
| Sierra Leoneans | 100.0 /100 | #5 | Exceptional 68.9% |
| Immigrants | Eritrea | 100.0 /100 | #6 | Exceptional 68.9% |
| Immigrants | Cameroon | 100.0 /100 | #7 | Exceptional 68.7% |
| Immigrants | Sierra Leone | 100.0 /100 | #8 | Exceptional 68.5% |
| Immigrants | Eastern Africa | 100.0 /100 | #9 | Exceptional 68.5% |
| Immigrants | Bolivia | 100.0 /100 | #10 | Exceptional 68.4% |
| Bolivians | 100.0 /100 | #11 | Exceptional 68.2% |
| Sudanese | 100.0 /100 | #12 | Exceptional 68.0% |
| Immigrants | Nepal | 100.0 /100 | #13 | Exceptional 68.0% |
| Liberians | 100.0 /100 | #14 | Exceptional 67.8% |
| Immigrants | Middle Africa | 100.0 /100 | #15 | Exceptional 67.7% |
| Immigrants | Sudan | 100.0 /100 | #16 | Exceptional 67.7% |
| Immigrants | India | 100.0 /100 | #17 | Exceptional 67.6% |
| Immigrants | Liberia | 100.0 /100 | #18 | Exceptional 67.6% |
| Kenyans | 100.0 /100 | #19 | Exceptional 67.6% |
Demographics Similar to Trinidadians and Tobagonians by In Labor Force | Age > 16
In terms of in labor force | age > 16, the demographic groups most similar to Trinidadians and Tobagonians are Eastern European (65.1%, a difference of 0.010%), Immigrants from Haiti (65.1%, a difference of 0.020%), Swedish (65.1%, a difference of 0.030%), Immigrants from Latvia (65.1%, a difference of 0.030%), and Immigrants from Panama (65.1%, a difference of 0.030%).
| Demographics | Rating | Rank | In Labor Force | Age > 16 |
| Israelis | 61.6 /100 | #171 | Good 65.2% |
| Immigrants | Sweden | 61.3 /100 | #172 | Good 65.2% |
| Immigrants | Ukraine | 53.7 /100 | #173 | Average 65.1% |
| Macedonians | 50.0 /100 | #174 | Average 65.1% |
| Nicaraguans | 49.7 /100 | #175 | Average 65.1% |
| Swedes | 47.4 /100 | #176 | Average 65.1% |
| Eastern Europeans | 46.2 /100 | #177 | Average 65.1% |
| Trinidadians and Tobagonians | 45.2 /100 | #178 | Average 65.1% |
| Immigrants | Haiti | 43.3 /100 | #179 | Average 65.1% |
| Immigrants | Latvia | 42.9 /100 | #180 | Average 65.1% |
| Immigrants | Panama | 42.4 /100 | #181 | Average 65.1% |
| Immigrants | Nicaragua | 41.1 /100 | #182 | Average 65.1% |
| Soviet Union | 40.5 /100 | #183 | Average 65.0% |
| Carpatho Rusyns | 40.0 /100 | #184 | Average 65.0% |
| Syrians | 40.0 /100 | #185 | Average 65.0% |