Sudanese vs Immigrants from Dominica In Labor Force | Age 35-44
COMPARE
Sudanese
Immigrants from Dominica
In Labor Force | Age 35-44
In Labor Force | Age 35-44 Comparison
Sudanese
Immigrants from Dominica
85.0%
IN LABOR FORCE | AGE 35-44
99.0/ 100
METRIC RATING
69th/ 347
METRIC RANK
83.5%
IN LABOR FORCE | AGE 35-44
0.2/ 100
METRIC RATING
261st/ 347
METRIC RANK
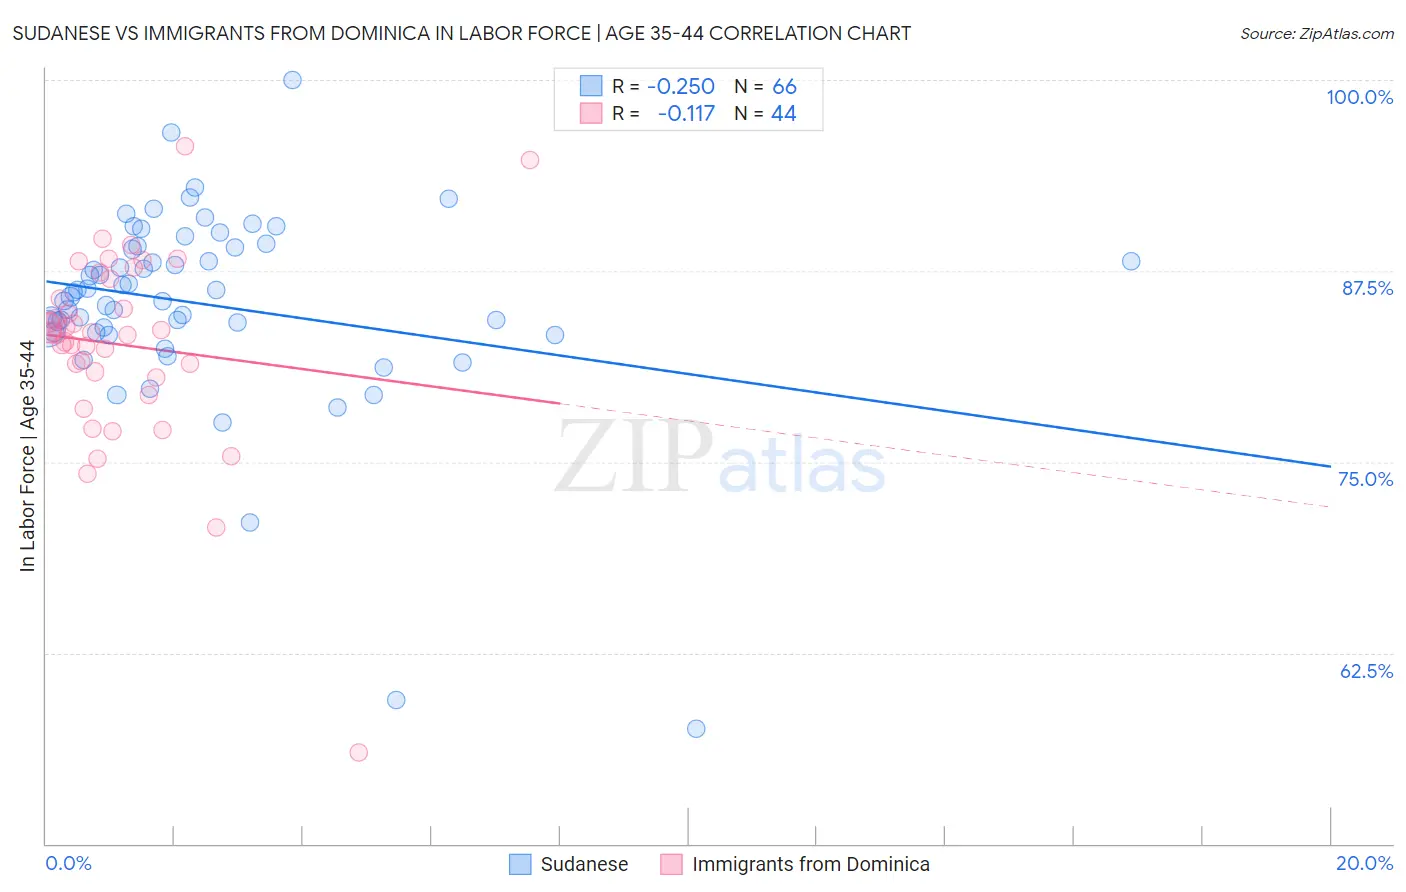
Sudanese vs Immigrants from Dominica In Labor Force | Age 35-44 Correlation Chart
The statistical analysis conducted on geographies consisting of 110,129,282 people shows a weak negative correlation between the proportion of Sudanese and labor force participation rate among population between the ages 35 and 44 in the United States with a correlation coefficient (R) of -0.250 and weighted average of 85.0%. Similarly, the statistical analysis conducted on geographies consisting of 83,785,416 people shows a poor negative correlation between the proportion of Immigrants from Dominica and labor force participation rate among population between the ages 35 and 44 in the United States with a correlation coefficient (R) of -0.117 and weighted average of 83.5%, a difference of 1.8%.
In Labor Force | Age 35-44 Correlation Summary
| Measurement | Sudanese | Immigrants from Dominica |
| Minimum | 57.5% | 56.0% |
| Maximum | 100.0% | 95.7% |
| Range | 42.5% | 39.7% |
| Mean | 85.3% | 82.7% |
| Median | 85.9% | 83.4% |
| Interquartile 25% (IQ1) | 83.5% | 80.7% |
| Interquartile 75% (IQ3) | 89.0% | 86.4% |
| Interquartile Range (IQR) | 5.5% | 5.7% |
| Standard Deviation (Sample) | 6.6% | 6.5% |
| Standard Deviation (Population) | 6.5% | 6.4% |
Similar Demographics by In Labor Force | Age 35-44
Demographics Similar to Sudanese by In Labor Force | Age 35-44
In terms of in labor force | age 35-44, the demographic groups most similar to Sudanese are Brazilian (85.0%, a difference of 0.0%), Immigrants from Italy (85.0%, a difference of 0.010%), Italian (85.0%, a difference of 0.010%), Russian (85.0%, a difference of 0.010%), and Immigrants from Haiti (85.0%, a difference of 0.020%).
| Demographics | Rating | Rank | In Labor Force | Age 35-44 |
| Immigrants | Moldova | 99.3 /100 | #62 | Exceptional 85.0% |
| Immigrants | Uganda | 99.3 /100 | #63 | Exceptional 85.0% |
| Swedes | 99.2 /100 | #64 | Exceptional 85.0% |
| Immigrants | Brazil | 99.2 /100 | #65 | Exceptional 85.0% |
| Immigrants | Haiti | 99.1 /100 | #66 | Exceptional 85.0% |
| Immigrants | Italy | 99.1 /100 | #67 | Exceptional 85.0% |
| Italians | 99.1 /100 | #68 | Exceptional 85.0% |
| Sudanese | 99.0 /100 | #69 | Exceptional 85.0% |
| Brazilians | 99.0 /100 | #70 | Exceptional 85.0% |
| Russians | 99.0 /100 | #71 | Exceptional 85.0% |
| Immigrants | Singapore | 98.9 /100 | #72 | Exceptional 85.0% |
| Immigrants | Sri Lanka | 98.9 /100 | #73 | Exceptional 85.0% |
| Colombians | 98.8 /100 | #74 | Exceptional 85.0% |
| Immigrants | South Central Asia | 98.7 /100 | #75 | Exceptional 85.0% |
| Immigrants | Cuba | 98.6 /100 | #76 | Exceptional 84.9% |
Demographics Similar to Immigrants from Dominica by In Labor Force | Age 35-44
In terms of in labor force | age 35-44, the demographic groups most similar to Immigrants from Dominica are Vietnamese (83.5%, a difference of 0.0%), Immigrants from El Salvador (83.5%, a difference of 0.010%), Immigrants from Congo (83.5%, a difference of 0.010%), Iroquois (83.5%, a difference of 0.030%), and Tsimshian (83.5%, a difference of 0.040%).
| Demographics | Rating | Rank | In Labor Force | Age 35-44 |
| Tongans | 0.4 /100 | #254 | Tragic 83.6% |
| Immigrants | Azores | 0.3 /100 | #255 | Tragic 83.6% |
| Japanese | 0.3 /100 | #256 | Tragic 83.6% |
| Basques | 0.3 /100 | #257 | Tragic 83.6% |
| Tsimshian | 0.2 /100 | #258 | Tragic 83.5% |
| Immigrants | El Salvador | 0.2 /100 | #259 | Tragic 83.5% |
| Vietnamese | 0.2 /100 | #260 | Tragic 83.5% |
| Immigrants | Dominica | 0.2 /100 | #261 | Tragic 83.5% |
| Immigrants | Congo | 0.2 /100 | #262 | Tragic 83.5% |
| Iroquois | 0.2 /100 | #263 | Tragic 83.5% |
| Scotch-Irish | 0.1 /100 | #264 | Tragic 83.5% |
| Central Americans | 0.1 /100 | #265 | Tragic 83.5% |
| Spaniards | 0.1 /100 | #266 | Tragic 83.4% |
| Guamanians/Chamorros | 0.1 /100 | #267 | Tragic 83.4% |
| Hondurans | 0.1 /100 | #268 | Tragic 83.4% |