Sudanese vs Asian In Labor Force | Age 35-44
COMPARE
Sudanese
Asian
In Labor Force | Age 35-44
In Labor Force | Age 35-44 Comparison
Sudanese
Asians
85.0%
IN LABOR FORCE | AGE 35-44
99.0/ 100
METRIC RATING
69th/ 347
METRIC RANK
84.7%
IN LABOR FORCE | AGE 35-44
90.6/ 100
METRIC RATING
126th/ 347
METRIC RANK
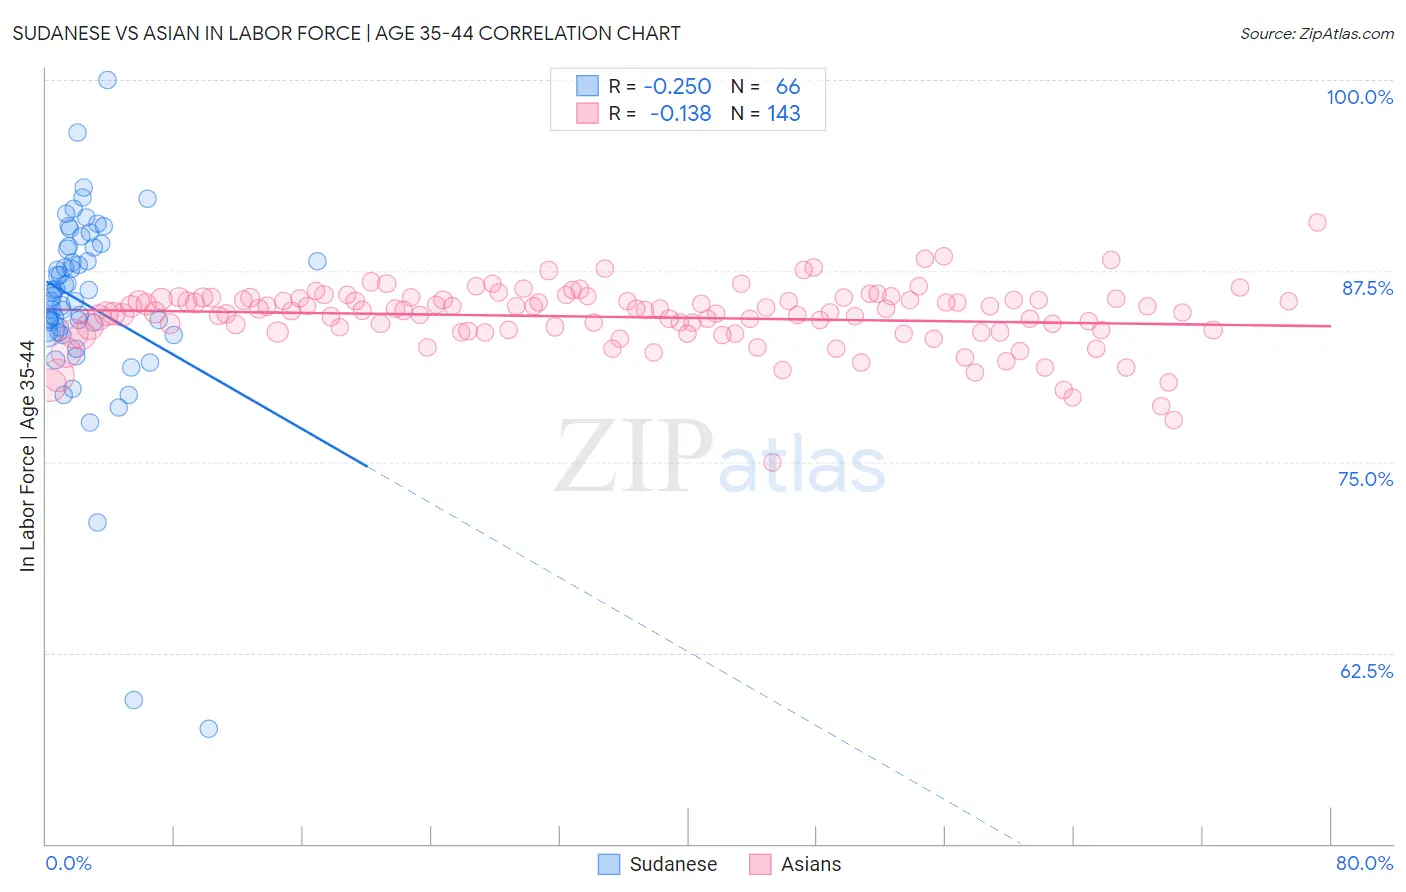
Sudanese vs Asian In Labor Force | Age 35-44 Correlation Chart
The statistical analysis conducted on geographies consisting of 110,129,282 people shows a weak negative correlation between the proportion of Sudanese and labor force participation rate among population between the ages 35 and 44 in the United States with a correlation coefficient (R) of -0.250 and weighted average of 85.0%. Similarly, the statistical analysis conducted on geographies consisting of 550,310,951 people shows a poor negative correlation between the proportion of Asians and labor force participation rate among population between the ages 35 and 44 in the United States with a correlation coefficient (R) of -0.138 and weighted average of 84.7%, a difference of 0.38%.
In Labor Force | Age 35-44 Correlation Summary
| Measurement | Sudanese | Asian |
| Minimum | 57.5% | 74.9% |
| Maximum | 100.0% | 90.7% |
| Range | 42.5% | 15.8% |
| Mean | 85.3% | 84.5% |
| Median | 85.9% | 84.9% |
| Interquartile 25% (IQ1) | 83.5% | 83.5% |
| Interquartile 75% (IQ3) | 89.0% | 85.6% |
| Interquartile Range (IQR) | 5.5% | 2.1% |
| Standard Deviation (Sample) | 6.6% | 2.1% |
| Standard Deviation (Population) | 6.5% | 2.1% |
Similar Demographics by In Labor Force | Age 35-44
Demographics Similar to Sudanese by In Labor Force | Age 35-44
In terms of in labor force | age 35-44, the demographic groups most similar to Sudanese are Brazilian (85.0%, a difference of 0.0%), Immigrants from Italy (85.0%, a difference of 0.010%), Italian (85.0%, a difference of 0.010%), Russian (85.0%, a difference of 0.010%), and Immigrants from Haiti (85.0%, a difference of 0.020%).
| Demographics | Rating | Rank | In Labor Force | Age 35-44 |
| Immigrants | Moldova | 99.3 /100 | #62 | Exceptional 85.0% |
| Immigrants | Uganda | 99.3 /100 | #63 | Exceptional 85.0% |
| Swedes | 99.2 /100 | #64 | Exceptional 85.0% |
| Immigrants | Brazil | 99.2 /100 | #65 | Exceptional 85.0% |
| Immigrants | Haiti | 99.1 /100 | #66 | Exceptional 85.0% |
| Immigrants | Italy | 99.1 /100 | #67 | Exceptional 85.0% |
| Italians | 99.1 /100 | #68 | Exceptional 85.0% |
| Sudanese | 99.0 /100 | #69 | Exceptional 85.0% |
| Brazilians | 99.0 /100 | #70 | Exceptional 85.0% |
| Russians | 99.0 /100 | #71 | Exceptional 85.0% |
| Immigrants | Singapore | 98.9 /100 | #72 | Exceptional 85.0% |
| Immigrants | Sri Lanka | 98.9 /100 | #73 | Exceptional 85.0% |
| Colombians | 98.8 /100 | #74 | Exceptional 85.0% |
| Immigrants | South Central Asia | 98.7 /100 | #75 | Exceptional 85.0% |
| Immigrants | Cuba | 98.6 /100 | #76 | Exceptional 84.9% |
Demographics Similar to Asians by In Labor Force | Age 35-44
In terms of in labor force | age 35-44, the demographic groups most similar to Asians are Slavic (84.7%, a difference of 0.0%), Maltese (84.7%, a difference of 0.0%), Immigrants from Spain (84.7%, a difference of 0.0%), Immigrants from Ghana (84.7%, a difference of 0.0%), and Finnish (84.7%, a difference of 0.010%).
| Demographics | Rating | Rank | In Labor Force | Age 35-44 |
| Burmese | 91.8 /100 | #119 | Exceptional 84.7% |
| Immigrants | Northern Europe | 91.5 /100 | #120 | Exceptional 84.7% |
| Finns | 91.2 /100 | #121 | Exceptional 84.7% |
| Germans | 91.0 /100 | #122 | Exceptional 84.7% |
| Immigrants | South America | 90.9 /100 | #123 | Exceptional 84.7% |
| Slavs | 90.8 /100 | #124 | Exceptional 84.7% |
| Maltese | 90.8 /100 | #125 | Exceptional 84.7% |
| Asians | 90.6 /100 | #126 | Exceptional 84.7% |
| Immigrants | Spain | 90.6 /100 | #127 | Exceptional 84.7% |
| Immigrants | Ghana | 90.4 /100 | #128 | Exceptional 84.7% |
| Palestinians | 89.7 /100 | #129 | Excellent 84.7% |
| Bhutanese | 89.7 /100 | #130 | Excellent 84.7% |
| Immigrants | Scotland | 89.6 /100 | #131 | Excellent 84.7% |
| Austrians | 89.4 /100 | #132 | Excellent 84.7% |
| Argentineans | 88.4 /100 | #133 | Excellent 84.6% |