Sri Lankan vs German Russian In Labor Force | Age 45-54
COMPARE
Sri Lankan
German Russian
In Labor Force | Age 45-54
In Labor Force | Age 45-54 Comparison
Sri Lankans
German Russians
83.2%
IN LABOR FORCE | AGE 45-54
93.2/ 100
METRIC RATING
106th/ 347
METRIC RANK
82.8%
IN LABOR FORCE | AGE 45-54
61.3/ 100
METRIC RATING
164th/ 347
METRIC RANK
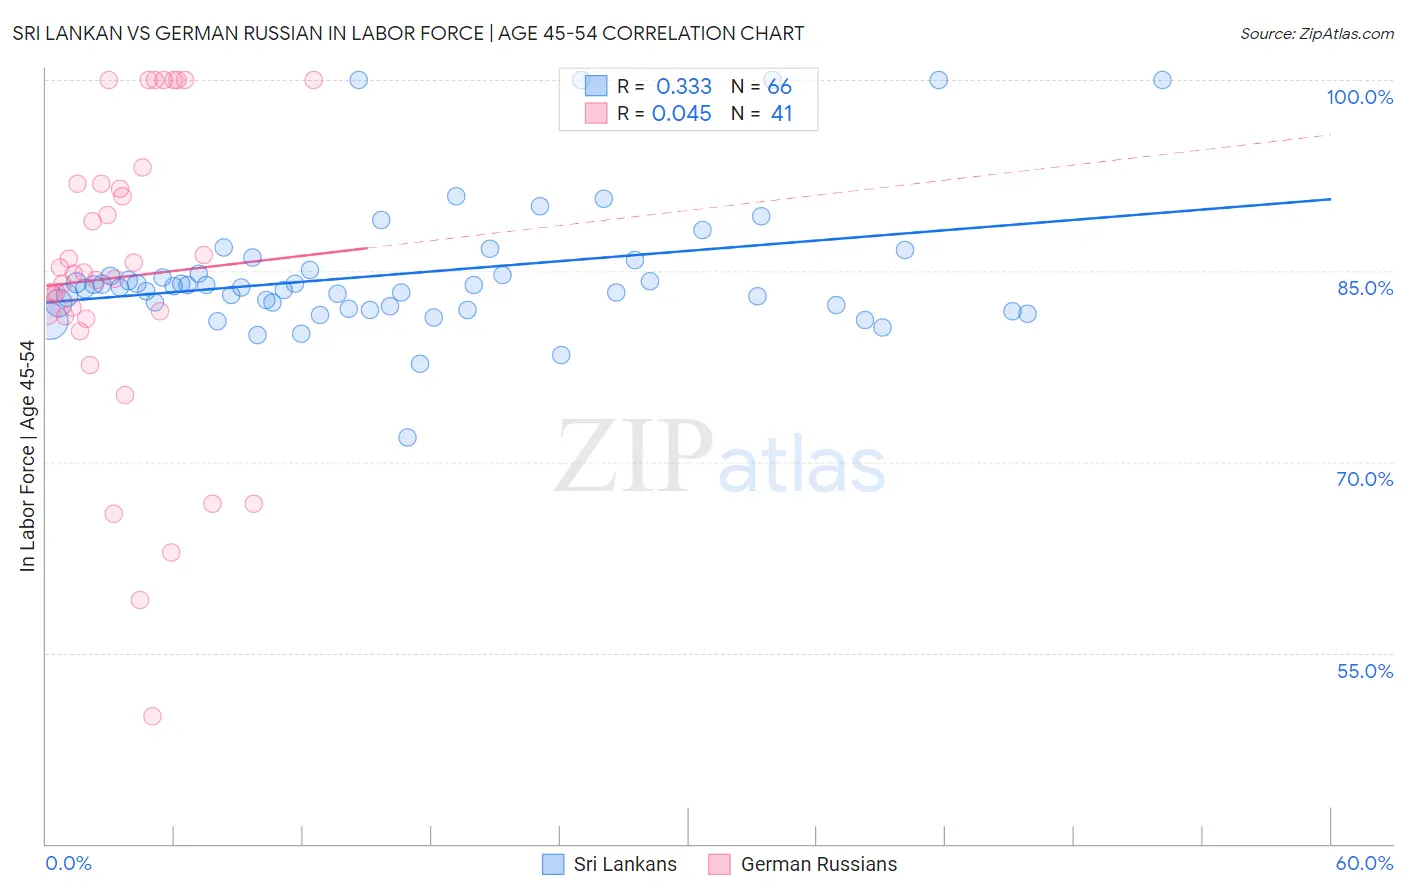
Sri Lankan vs German Russian In Labor Force | Age 45-54 Correlation Chart
The statistical analysis conducted on geographies consisting of 440,078,973 people shows a mild positive correlation between the proportion of Sri Lankans and labor force participation rate among population between the ages 45 and 54 in the United States with a correlation coefficient (R) of 0.333 and weighted average of 83.2%. Similarly, the statistical analysis conducted on geographies consisting of 96,442,548 people shows no correlation between the proportion of German Russians and labor force participation rate among population between the ages 45 and 54 in the United States with a correlation coefficient (R) of 0.045 and weighted average of 82.8%, a difference of 0.47%.
In Labor Force | Age 45-54 Correlation Summary
| Measurement | Sri Lankan | German Russian |
| Minimum | 72.0% | 50.0% |
| Maximum | 100.0% | 100.0% |
| Range | 28.0% | 50.0% |
| Mean | 84.8% | 84.5% |
| Median | 83.7% | 84.8% |
| Interquartile 25% (IQ1) | 82.2% | 81.4% |
| Interquartile 75% (IQ3) | 85.1% | 91.9% |
| Interquartile Range (IQR) | 2.8% | 10.5% |
| Standard Deviation (Sample) | 5.3% | 12.0% |
| Standard Deviation (Population) | 5.2% | 11.8% |
Similar Demographics by In Labor Force | Age 45-54
Demographics Similar to Sri Lankans by In Labor Force | Age 45-54
In terms of in labor force | age 45-54, the demographic groups most similar to Sri Lankans are Immigrants from South America (83.2%, a difference of 0.010%), Iranian (83.2%, a difference of 0.010%), Slovak (83.2%, a difference of 0.010%), Immigrants from Romania (83.3%, a difference of 0.020%), and Ukrainian (83.2%, a difference of 0.020%).
| Demographics | Rating | Rank | In Labor Force | Age 45-54 |
| Immigrants | Middle Africa | 94.3 /100 | #99 | Exceptional 83.3% |
| Mongolians | 94.2 /100 | #100 | Exceptional 83.3% |
| Immigrants | Belarus | 94.1 /100 | #101 | Exceptional 83.3% |
| Immigrants | Singapore | 93.9 /100 | #102 | Exceptional 83.3% |
| Albanians | 93.9 /100 | #103 | Exceptional 83.3% |
| Immigrants | Romania | 93.8 /100 | #104 | Exceptional 83.3% |
| Immigrants | South America | 93.5 /100 | #105 | Exceptional 83.2% |
| Sri Lankans | 93.2 /100 | #106 | Exceptional 83.2% |
| Iranians | 92.9 /100 | #107 | Exceptional 83.2% |
| Slovaks | 92.8 /100 | #108 | Exceptional 83.2% |
| Ukrainians | 92.7 /100 | #109 | Exceptional 83.2% |
| Immigrants | Africa | 92.6 /100 | #110 | Exceptional 83.2% |
| Immigrants | Italy | 92.5 /100 | #111 | Exceptional 83.2% |
| Immigrants | Afghanistan | 92.4 /100 | #112 | Exceptional 83.2% |
| Immigrants | Albania | 91.8 /100 | #113 | Exceptional 83.2% |
Demographics Similar to German Russians by In Labor Force | Age 45-54
In terms of in labor force | age 45-54, the demographic groups most similar to German Russians are Haitian (82.8%, a difference of 0.0%), Dutch (82.8%, a difference of 0.0%), Laotian (82.9%, a difference of 0.010%), South American Indian (82.9%, a difference of 0.010%), and Immigrants from Sudan (82.8%, a difference of 0.010%).
| Demographics | Rating | Rank | In Labor Force | Age 45-54 |
| Immigrants | Australia | 68.2 /100 | #157 | Good 82.9% |
| Immigrants | Southern Europe | 67.8 /100 | #158 | Good 82.9% |
| Immigrants | Austria | 64.6 /100 | #159 | Good 82.9% |
| Laotians | 62.8 /100 | #160 | Good 82.9% |
| South American Indians | 62.2 /100 | #161 | Good 82.9% |
| Haitians | 61.8 /100 | #162 | Good 82.8% |
| Dutch | 61.7 /100 | #163 | Good 82.8% |
| German Russians | 61.3 /100 | #164 | Good 82.8% |
| Immigrants | Sudan | 59.9 /100 | #165 | Average 82.8% |
| Immigrants | South Eastern Asia | 57.4 /100 | #166 | Average 82.8% |
| Swiss | 56.5 /100 | #167 | Average 82.8% |
| Immigrants | South Africa | 55.8 /100 | #168 | Average 82.8% |
| Immigrants | Western Africa | 54.1 /100 | #169 | Average 82.8% |
| Pakistanis | 53.2 /100 | #170 | Average 82.8% |
| Immigrants | Zaire | 52.9 /100 | #171 | Average 82.8% |