Sri Lankan vs Immigrants from Jordan In Labor Force | Age 45-54
COMPARE
Sri Lankan
Immigrants from Jordan
In Labor Force | Age 45-54
In Labor Force | Age 45-54 Comparison
Sri Lankans
Immigrants from Jordan
83.2%
IN LABOR FORCE | AGE 45-54
93.2/ 100
METRIC RATING
106th/ 347
METRIC RANK
83.1%
IN LABOR FORCE | AGE 45-54
85.2/ 100
METRIC RATING
127th/ 347
METRIC RANK
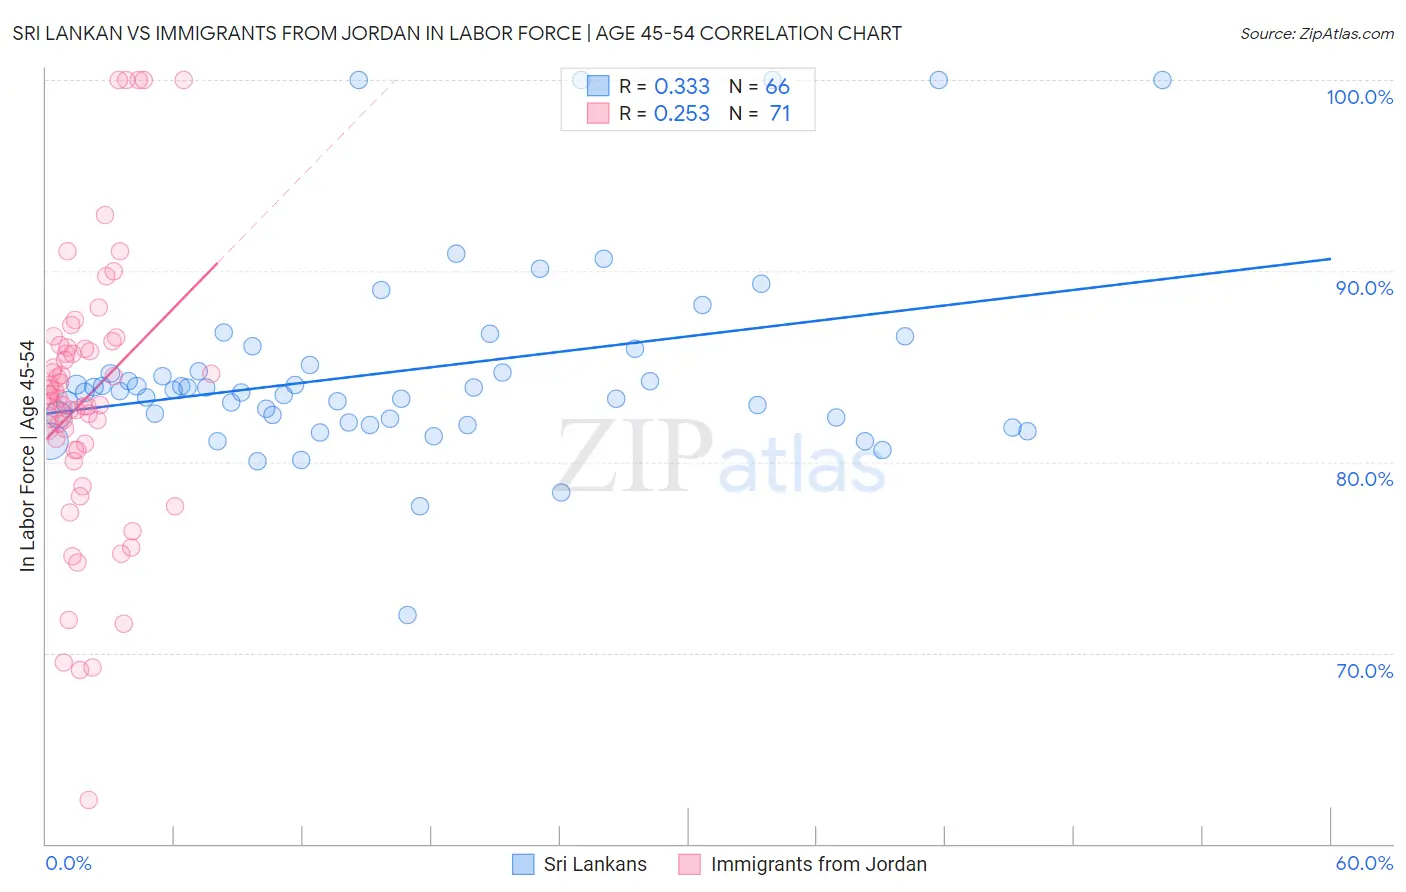
Sri Lankan vs Immigrants from Jordan In Labor Force | Age 45-54 Correlation Chart
The statistical analysis conducted on geographies consisting of 440,078,973 people shows a mild positive correlation between the proportion of Sri Lankans and labor force participation rate among population between the ages 45 and 54 in the United States with a correlation coefficient (R) of 0.333 and weighted average of 83.2%. Similarly, the statistical analysis conducted on geographies consisting of 181,248,316 people shows a weak positive correlation between the proportion of Immigrants from Jordan and labor force participation rate among population between the ages 45 and 54 in the United States with a correlation coefficient (R) of 0.253 and weighted average of 83.1%, a difference of 0.19%.
In Labor Force | Age 45-54 Correlation Summary
| Measurement | Sri Lankan | Immigrants from Jordan |
| Minimum | 72.0% | 62.3% |
| Maximum | 100.0% | 100.0% |
| Range | 28.0% | 37.7% |
| Mean | 84.8% | 83.3% |
| Median | 83.7% | 83.3% |
| Interquartile 25% (IQ1) | 82.2% | 80.6% |
| Interquartile 75% (IQ3) | 85.1% | 86.0% |
| Interquartile Range (IQR) | 2.8% | 5.3% |
| Standard Deviation (Sample) | 5.3% | 7.2% |
| Standard Deviation (Population) | 5.2% | 7.1% |
Similar Demographics by In Labor Force | Age 45-54
Demographics Similar to Sri Lankans by In Labor Force | Age 45-54
In terms of in labor force | age 45-54, the demographic groups most similar to Sri Lankans are Immigrants from South America (83.2%, a difference of 0.010%), Iranian (83.2%, a difference of 0.010%), Slovak (83.2%, a difference of 0.010%), Immigrants from Romania (83.3%, a difference of 0.020%), and Ukrainian (83.2%, a difference of 0.020%).
| Demographics | Rating | Rank | In Labor Force | Age 45-54 |
| Immigrants | Middle Africa | 94.3 /100 | #99 | Exceptional 83.3% |
| Mongolians | 94.2 /100 | #100 | Exceptional 83.3% |
| Immigrants | Belarus | 94.1 /100 | #101 | Exceptional 83.3% |
| Immigrants | Singapore | 93.9 /100 | #102 | Exceptional 83.3% |
| Albanians | 93.9 /100 | #103 | Exceptional 83.3% |
| Immigrants | Romania | 93.8 /100 | #104 | Exceptional 83.3% |
| Immigrants | South America | 93.5 /100 | #105 | Exceptional 83.2% |
| Sri Lankans | 93.2 /100 | #106 | Exceptional 83.2% |
| Iranians | 92.9 /100 | #107 | Exceptional 83.2% |
| Slovaks | 92.8 /100 | #108 | Exceptional 83.2% |
| Ukrainians | 92.7 /100 | #109 | Exceptional 83.2% |
| Immigrants | Africa | 92.6 /100 | #110 | Exceptional 83.2% |
| Immigrants | Italy | 92.5 /100 | #111 | Exceptional 83.2% |
| Immigrants | Afghanistan | 92.4 /100 | #112 | Exceptional 83.2% |
| Immigrants | Albania | 91.8 /100 | #113 | Exceptional 83.2% |
Demographics Similar to Immigrants from Jordan by In Labor Force | Age 45-54
In terms of in labor force | age 45-54, the demographic groups most similar to Immigrants from Jordan are German (83.1%, a difference of 0.0%), Immigrants from Northern Europe (83.1%, a difference of 0.0%), Immigrants from Israel (83.1%, a difference of 0.010%), Immigrants from Belgium (83.1%, a difference of 0.020%), and Finnish (83.1%, a difference of 0.030%).
| Demographics | Rating | Rank | In Labor Force | Age 45-54 |
| Immigrants | Russia | 90.1 /100 | #120 | Exceptional 83.2% |
| Uruguayans | 89.4 /100 | #121 | Excellent 83.1% |
| Immigrants | Vietnam | 88.9 /100 | #122 | Excellent 83.1% |
| Tongans | 88.2 /100 | #123 | Excellent 83.1% |
| Bermudans | 88.0 /100 | #124 | Excellent 83.1% |
| Immigrants | Iran | 87.2 /100 | #125 | Excellent 83.1% |
| Immigrants | Belgium | 86.4 /100 | #126 | Excellent 83.1% |
| Immigrants | Jordan | 85.2 /100 | #127 | Excellent 83.1% |
| Germans | 85.1 /100 | #128 | Excellent 83.1% |
| Immigrants | Northern Europe | 85.1 /100 | #129 | Excellent 83.1% |
| Immigrants | Israel | 84.7 /100 | #130 | Excellent 83.1% |
| Finns | 83.3 /100 | #131 | Excellent 83.1% |
| Immigrants | Ukraine | 82.9 /100 | #132 | Excellent 83.0% |
| Liberians | 82.7 /100 | #133 | Excellent 83.0% |
| Sudanese | 82.0 /100 | #134 | Excellent 83.0% |