Sri Lankan vs Ute In Labor Force | Age 20-24
COMPARE
Sri Lankan
Ute
In Labor Force | Age 20-24
In Labor Force | Age 20-24 Comparison
Sri Lankans
Ute
74.9%
IN LABOR FORCE | AGE 20-24
34.9/ 100
METRIC RATING
185th/ 347
METRIC RANK
73.8%
IN LABOR FORCE | AGE 20-24
1.0/ 100
METRIC RATING
254th/ 347
METRIC RANK
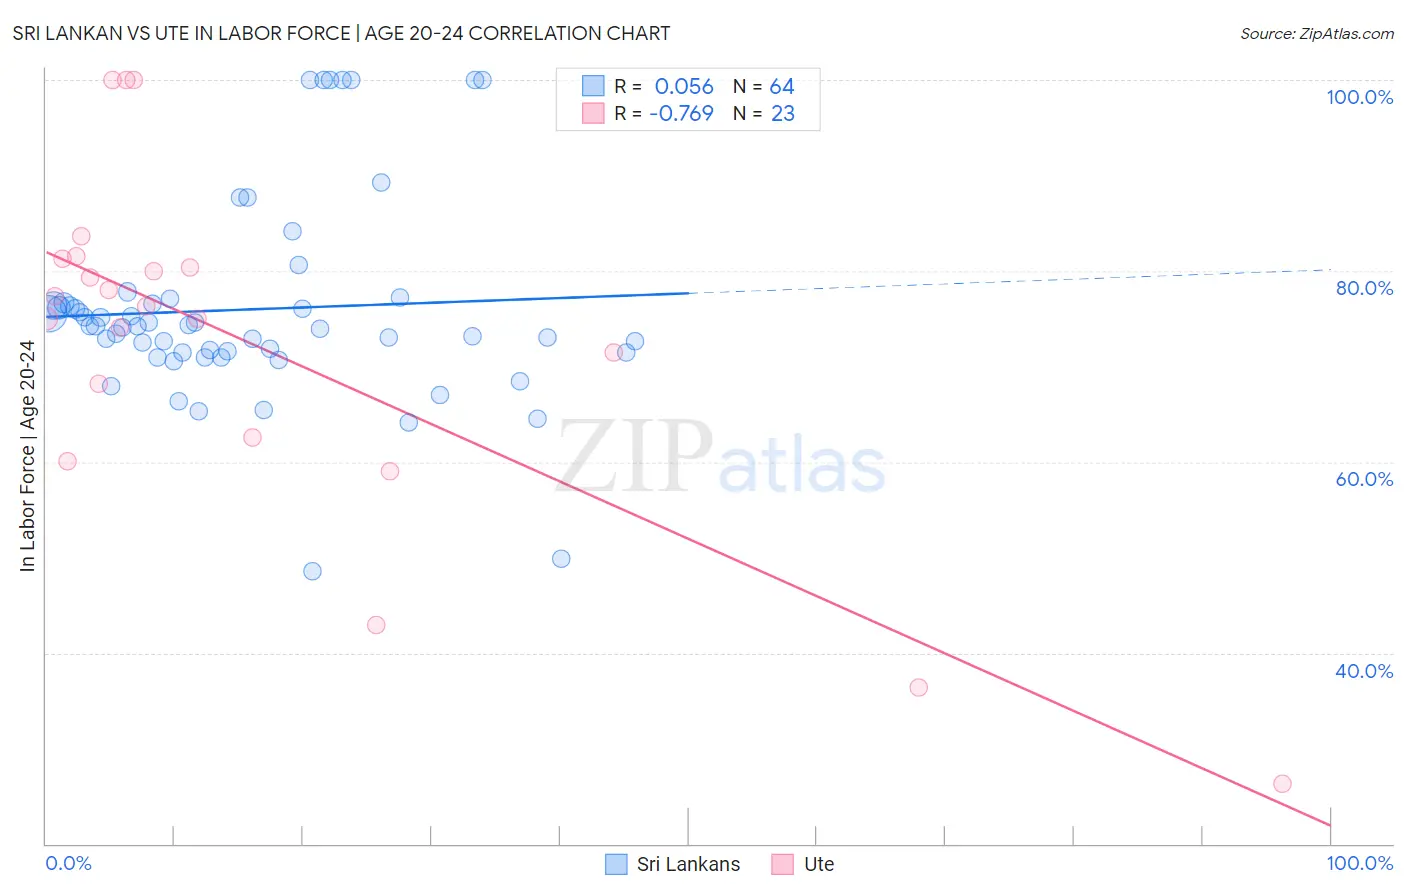
Sri Lankan vs Ute In Labor Force | Age 20-24 Correlation Chart
The statistical analysis conducted on geographies consisting of 440,468,605 people shows a slight positive correlation between the proportion of Sri Lankans and labor force participation rate among population between the ages 20 and 24 in the United States with a correlation coefficient (R) of 0.056 and weighted average of 74.9%. Similarly, the statistical analysis conducted on geographies consisting of 55,663,255 people shows a strong negative correlation between the proportion of Ute and labor force participation rate among population between the ages 20 and 24 in the United States with a correlation coefficient (R) of -0.769 and weighted average of 73.8%, a difference of 1.5%.
In Labor Force | Age 20-24 Correlation Summary
| Measurement | Sri Lankan | Ute |
| Minimum | 48.6% | 26.3% |
| Maximum | 100.0% | 100.0% |
| Range | 51.4% | 73.7% |
| Mean | 76.0% | 72.5% |
| Median | 74.2% | 76.4% |
| Interquartile 25% (IQ1) | 71.4% | 62.5% |
| Interquartile 75% (IQ3) | 76.6% | 81.3% |
| Interquartile Range (IQR) | 5.2% | 18.8% |
| Standard Deviation (Sample) | 10.7% | 18.6% |
| Standard Deviation (Population) | 10.6% | 18.1% |
Similar Demographics by In Labor Force | Age 20-24
Demographics Similar to Sri Lankans by In Labor Force | Age 20-24
In terms of in labor force | age 20-24, the demographic groups most similar to Sri Lankans are Immigrants from Hungary (74.9%, a difference of 0.0%), Immigrants from Eastern Europe (74.9%, a difference of 0.020%), Immigrants from Honduras (74.9%, a difference of 0.020%), Immigrants from South Africa (74.9%, a difference of 0.030%), and Immigrants from Costa Rica (74.9%, a difference of 0.030%).
| Demographics | Rating | Rank | In Labor Force | Age 20-24 |
| Immigrants | Central America | 45.0 /100 | #178 | Average 75.0% |
| Immigrants | Latvia | 44.1 /100 | #179 | Average 75.0% |
| Immigrants | Czechoslovakia | 44.0 /100 | #180 | Average 75.0% |
| Africans | 42.5 /100 | #181 | Average 75.0% |
| Immigrants | South Africa | 36.9 /100 | #182 | Fair 74.9% |
| Immigrants | Costa Rica | 36.7 /100 | #183 | Fair 74.9% |
| Immigrants | Hungary | 35.0 /100 | #184 | Fair 74.9% |
| Sri Lankans | 34.9 /100 | #185 | Fair 74.9% |
| Immigrants | Eastern Europe | 33.8 /100 | #186 | Fair 74.9% |
| Immigrants | Honduras | 33.5 /100 | #187 | Fair 74.9% |
| Hondurans | 32.7 /100 | #188 | Fair 74.8% |
| Immigrants | Northern Europe | 32.6 /100 | #189 | Fair 74.8% |
| Russians | 32.2 /100 | #190 | Fair 74.8% |
| Senegalese | 28.1 /100 | #191 | Fair 74.8% |
| Immigrants | Europe | 27.5 /100 | #192 | Fair 74.8% |
Demographics Similar to Ute by In Labor Force | Age 20-24
In terms of in labor force | age 20-24, the demographic groups most similar to Ute are Arapaho (73.8%, a difference of 0.0%), Immigrants from Pakistan (73.8%, a difference of 0.020%), Immigrants from Kazakhstan (73.8%, a difference of 0.050%), Immigrants from Egypt (73.8%, a difference of 0.070%), and Spanish American Indian (73.7%, a difference of 0.070%).
| Demographics | Rating | Rank | In Labor Force | Age 20-24 |
| Colville | 1.5 /100 | #247 | Tragic 73.9% |
| Immigrants | Saudi Arabia | 1.5 /100 | #248 | Tragic 73.9% |
| Blacks/African Americans | 1.3 /100 | #249 | Tragic 73.9% |
| Immigrants | Belgium | 1.3 /100 | #250 | Tragic 73.9% |
| Immigrants | Egypt | 1.2 /100 | #251 | Tragic 73.8% |
| Immigrants | Kazakhstan | 1.1 /100 | #252 | Tragic 73.8% |
| Arapaho | 1.0 /100 | #253 | Tragic 73.8% |
| Ute | 1.0 /100 | #254 | Tragic 73.8% |
| Immigrants | Pakistan | 0.9 /100 | #255 | Tragic 73.8% |
| Spanish American Indians | 0.8 /100 | #256 | Tragic 73.7% |
| Paraguayans | 0.8 /100 | #257 | Tragic 73.7% |
| Egyptians | 0.7 /100 | #258 | Tragic 73.7% |
| Dutch West Indians | 0.7 /100 | #259 | Tragic 73.7% |
| Immigrants | Turkey | 0.7 /100 | #260 | Tragic 73.7% |
| Houma | 0.6 /100 | #261 | Tragic 73.7% |