Sri Lankan vs Jamaican In Labor Force | Age 16-19
COMPARE
Sri Lankan
Jamaican
In Labor Force | Age 16-19
In Labor Force | Age 16-19 Comparison
Sri Lankans
Jamaicans
35.5%
IN LABOR FORCE | AGE 16-19
9.8/ 100
METRIC RATING
218th/ 347
METRIC RANK
33.2%
IN LABOR FORCE | AGE 16-19
0.1/ 100
METRIC RATING
296th/ 347
METRIC RANK
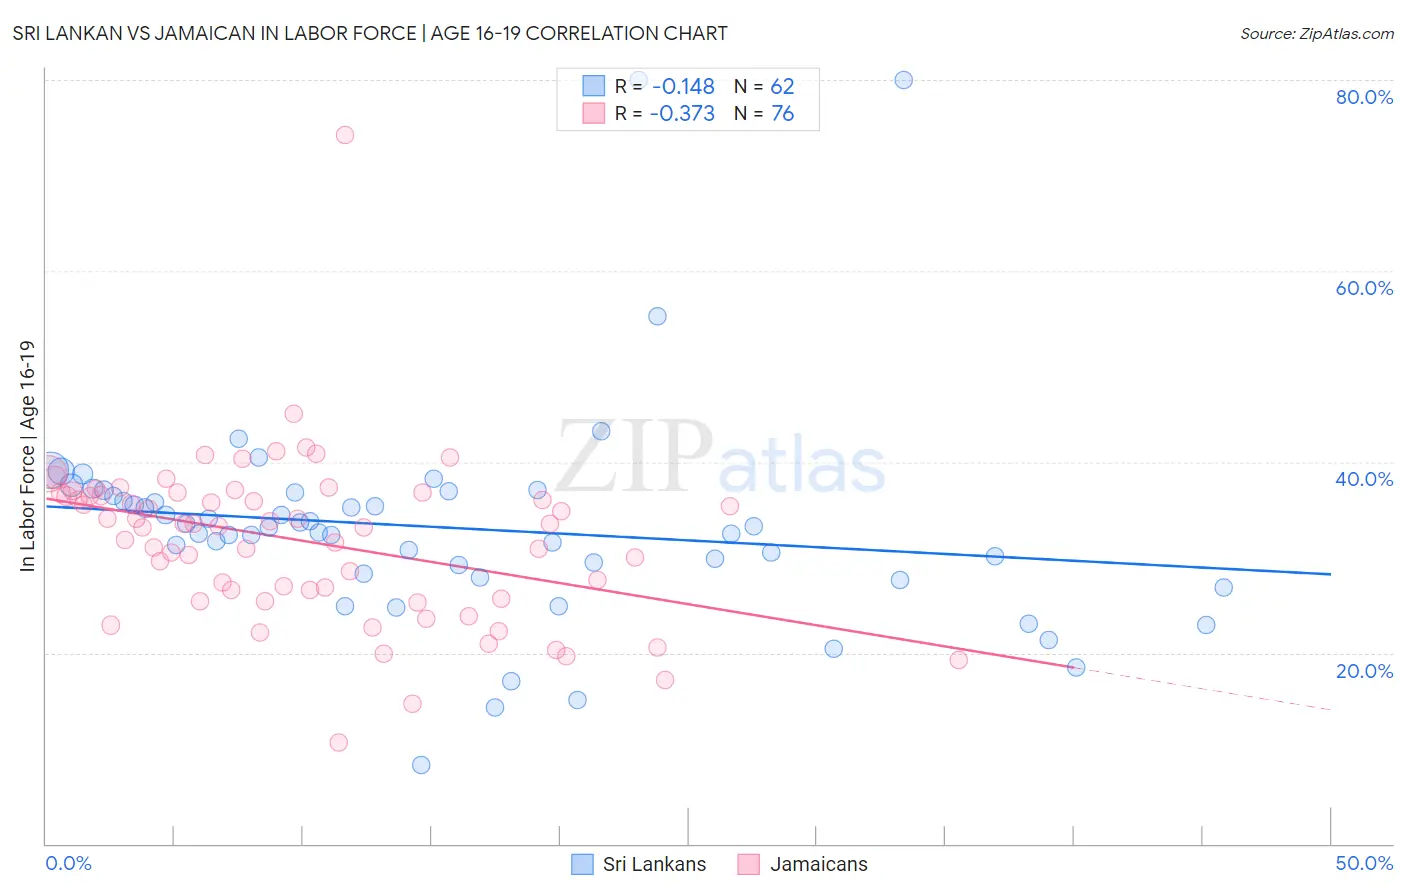
Sri Lankan vs Jamaican In Labor Force | Age 16-19 Correlation Chart
The statistical analysis conducted on geographies consisting of 440,040,037 people shows a poor negative correlation between the proportion of Sri Lankans and labor force participation rate among population between the ages 16 and 19 in the United States with a correlation coefficient (R) of -0.148 and weighted average of 35.5%. Similarly, the statistical analysis conducted on geographies consisting of 367,624,466 people shows a mild negative correlation between the proportion of Jamaicans and labor force participation rate among population between the ages 16 and 19 in the United States with a correlation coefficient (R) of -0.373 and weighted average of 33.2%, a difference of 7.0%.
In Labor Force | Age 16-19 Correlation Summary
| Measurement | Sri Lankan | Jamaican |
| Minimum | 8.2% | 10.6% |
| Maximum | 80.0% | 74.2% |
| Range | 71.8% | 63.6% |
| Mean | 33.1% | 31.7% |
| Median | 32.9% | 33.4% |
| Interquartile 25% (IQ1) | 28.3% | 26.1% |
| Interquartile 75% (IQ3) | 36.8% | 36.6% |
| Interquartile Range (IQR) | 8.5% | 10.5% |
| Standard Deviation (Sample) | 11.5% | 8.7% |
| Standard Deviation (Population) | 11.4% | 8.6% |
Similar Demographics by In Labor Force | Age 16-19
Demographics Similar to Sri Lankans by In Labor Force | Age 16-19
In terms of in labor force | age 16-19, the demographic groups most similar to Sri Lankans are Dutch West Indian (35.6%, a difference of 0.12%), Immigrants from Costa Rica (35.6%, a difference of 0.12%), Immigrants from South Eastern Asia (35.6%, a difference of 0.14%), Apache (35.6%, a difference of 0.16%), and Houma (35.6%, a difference of 0.17%).
| Demographics | Rating | Rank | In Labor Force | Age 16-19 |
| Mexicans | 11.9 /100 | #211 | Poor 35.6% |
| Houma | 11.0 /100 | #212 | Poor 35.6% |
| Immigrants | Bolivia | 11.0 /100 | #213 | Poor 35.6% |
| Apache | 11.0 /100 | #214 | Poor 35.6% |
| Immigrants | South Eastern Asia | 10.8 /100 | #215 | Poor 35.6% |
| Dutch West Indians | 10.7 /100 | #216 | Poor 35.6% |
| Immigrants | Costa Rica | 10.7 /100 | #217 | Poor 35.6% |
| Sri Lankans | 9.8 /100 | #218 | Tragic 35.5% |
| Guatemalans | 8.6 /100 | #219 | Tragic 35.5% |
| Immigrants | Bahamas | 8.3 /100 | #220 | Tragic 35.5% |
| Turks | 7.3 /100 | #221 | Tragic 35.4% |
| Immigrants | Ghana | 7.3 /100 | #222 | Tragic 35.4% |
| Ghanaians | 6.5 /100 | #223 | Tragic 35.3% |
| Hondurans | 6.5 /100 | #224 | Tragic 35.3% |
| Immigrants | Belgium | 6.1 /100 | #225 | Tragic 35.3% |
Demographics Similar to Jamaicans by In Labor Force | Age 16-19
In terms of in labor force | age 16-19, the demographic groups most similar to Jamaicans are Immigrants from Haiti (33.2%, a difference of 0.090%), Yup'ik (33.3%, a difference of 0.13%), Argentinean (33.3%, a difference of 0.23%), Immigrants from South America (33.3%, a difference of 0.25%), and Haitian (33.4%, a difference of 0.57%).
| Demographics | Rating | Rank | In Labor Force | Age 16-19 |
| Immigrants | Singapore | 0.1 /100 | #289 | Tragic 33.5% |
| Immigrants | Colombia | 0.1 /100 | #290 | Tragic 33.5% |
| Immigrants | Belarus | 0.1 /100 | #291 | Tragic 33.4% |
| Haitians | 0.1 /100 | #292 | Tragic 33.4% |
| Immigrants | South America | 0.1 /100 | #293 | Tragic 33.3% |
| Argentineans | 0.1 /100 | #294 | Tragic 33.3% |
| Yup'ik | 0.1 /100 | #295 | Tragic 33.3% |
| Jamaicans | 0.1 /100 | #296 | Tragic 33.2% |
| Immigrants | Haiti | 0.1 /100 | #297 | Tragic 33.2% |
| Iranians | 0.0 /100 | #298 | Tragic 33.0% |
| Armenians | 0.0 /100 | #299 | Tragic 32.9% |
| Immigrants | Argentina | 0.0 /100 | #300 | Tragic 32.9% |
| Okinawans | 0.0 /100 | #301 | Tragic 32.8% |
| Belizeans | 0.0 /100 | #302 | Tragic 32.8% |
| Immigrants | Dominica | 0.0 /100 | #303 | Tragic 32.5% |