Sri Lankan vs Swiss In Labor Force | Age 16-19
COMPARE
Sri Lankan
Swiss
In Labor Force | Age 16-19
In Labor Force | Age 16-19 Comparison
Sri Lankans
Swiss
35.5%
IN LABOR FORCE | AGE 16-19
9.8/ 100
METRIC RATING
218th/ 347
METRIC RANK
43.3%
IN LABOR FORCE | AGE 16-19
100.0/ 100
METRIC RATING
20th/ 347
METRIC RANK
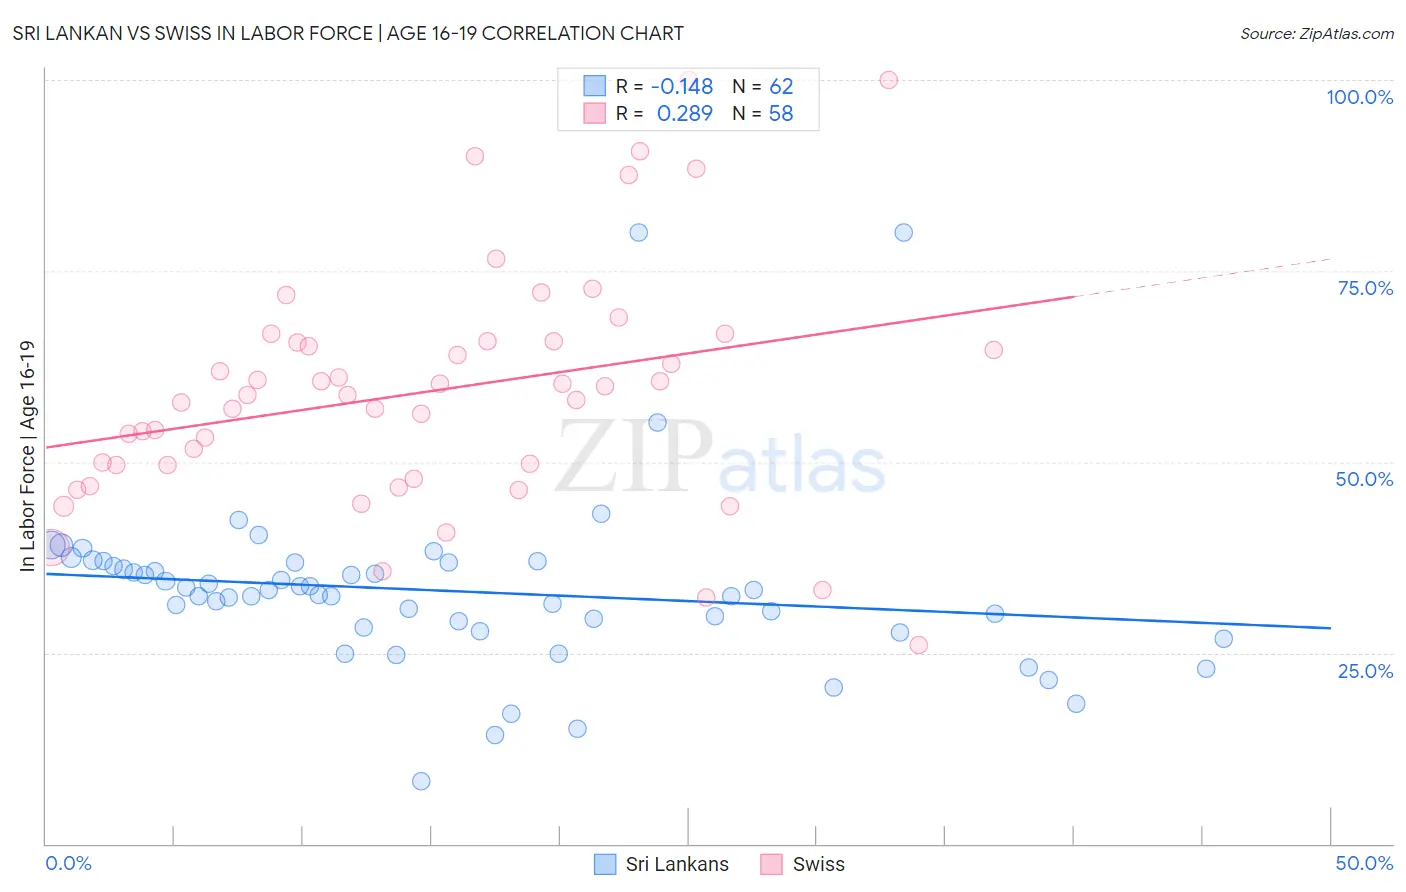
Sri Lankan vs Swiss In Labor Force | Age 16-19 Correlation Chart
The statistical analysis conducted on geographies consisting of 440,040,037 people shows a poor negative correlation between the proportion of Sri Lankans and labor force participation rate among population between the ages 16 and 19 in the United States with a correlation coefficient (R) of -0.148 and weighted average of 35.5%. Similarly, the statistical analysis conducted on geographies consisting of 463,664,152 people shows a weak positive correlation between the proportion of Swiss and labor force participation rate among population between the ages 16 and 19 in the United States with a correlation coefficient (R) of 0.289 and weighted average of 43.3%, a difference of 21.7%.
In Labor Force | Age 16-19 Correlation Summary
| Measurement | Sri Lankan | Swiss |
| Minimum | 8.2% | 26.1% |
| Maximum | 80.0% | 100.0% |
| Range | 71.8% | 73.9% |
| Mean | 33.1% | 59.2% |
| Median | 32.9% | 58.8% |
| Interquartile 25% (IQ1) | 28.3% | 49.5% |
| Interquartile 75% (IQ3) | 36.8% | 65.8% |
| Interquartile Range (IQR) | 8.5% | 16.3% |
| Standard Deviation (Sample) | 11.5% | 15.7% |
| Standard Deviation (Population) | 11.4% | 15.5% |
Similar Demographics by In Labor Force | Age 16-19
Demographics Similar to Sri Lankans by In Labor Force | Age 16-19
In terms of in labor force | age 16-19, the demographic groups most similar to Sri Lankans are Dutch West Indian (35.6%, a difference of 0.12%), Immigrants from Costa Rica (35.6%, a difference of 0.12%), Immigrants from South Eastern Asia (35.6%, a difference of 0.14%), Apache (35.6%, a difference of 0.16%), and Houma (35.6%, a difference of 0.17%).
| Demographics | Rating | Rank | In Labor Force | Age 16-19 |
| Mexicans | 11.9 /100 | #211 | Poor 35.6% |
| Houma | 11.0 /100 | #212 | Poor 35.6% |
| Immigrants | Bolivia | 11.0 /100 | #213 | Poor 35.6% |
| Apache | 11.0 /100 | #214 | Poor 35.6% |
| Immigrants | South Eastern Asia | 10.8 /100 | #215 | Poor 35.6% |
| Dutch West Indians | 10.7 /100 | #216 | Poor 35.6% |
| Immigrants | Costa Rica | 10.7 /100 | #217 | Poor 35.6% |
| Sri Lankans | 9.8 /100 | #218 | Tragic 35.5% |
| Guatemalans | 8.6 /100 | #219 | Tragic 35.5% |
| Immigrants | Bahamas | 8.3 /100 | #220 | Tragic 35.5% |
| Turks | 7.3 /100 | #221 | Tragic 35.4% |
| Immigrants | Ghana | 7.3 /100 | #222 | Tragic 35.4% |
| Ghanaians | 6.5 /100 | #223 | Tragic 35.3% |
| Hondurans | 6.5 /100 | #224 | Tragic 35.3% |
| Immigrants | Belgium | 6.1 /100 | #225 | Tragic 35.3% |
Demographics Similar to Swiss by In Labor Force | Age 16-19
In terms of in labor force | age 16-19, the demographic groups most similar to Swiss are Belgian (43.4%, a difference of 0.22%), Ottawa (43.0%, a difference of 0.56%), French Canadian (43.6%, a difference of 0.73%), Scandinavian (43.6%, a difference of 0.80%), and Czech (43.6%, a difference of 0.87%).
| Demographics | Rating | Rank | In Labor Force | Age 16-19 |
| Dutch | 100.0 /100 | #13 | Exceptional 43.8% |
| Chippewa | 100.0 /100 | #14 | Exceptional 43.8% |
| Slovenes | 100.0 /100 | #15 | Exceptional 43.7% |
| Czechs | 100.0 /100 | #16 | Exceptional 43.6% |
| Scandinavians | 100.0 /100 | #17 | Exceptional 43.6% |
| French Canadians | 100.0 /100 | #18 | Exceptional 43.6% |
| Belgians | 100.0 /100 | #19 | Exceptional 43.4% |
| Swiss | 100.0 /100 | #20 | Exceptional 43.3% |
| Ottawa | 100.0 /100 | #21 | Exceptional 43.0% |
| Sudanese | 100.0 /100 | #22 | Exceptional 42.9% |
| Slovaks | 100.0 /100 | #23 | Exceptional 42.6% |
| Bangladeshis | 100.0 /100 | #24 | Exceptional 42.5% |
| German Russians | 100.0 /100 | #25 | Exceptional 42.4% |
| English | 100.0 /100 | #26 | Exceptional 42.4% |
| Welsh | 100.0 /100 | #27 | Exceptional 42.3% |