Sri Lankan vs Immigrants from Panama In Labor Force | Age 16-19
COMPARE
Sri Lankan
Immigrants from Panama
In Labor Force | Age 16-19
In Labor Force | Age 16-19 Comparison
Sri Lankans
Immigrants from Panama
35.5%
IN LABOR FORCE | AGE 16-19
9.8/ 100
METRIC RATING
218th/ 347
METRIC RANK
34.0%
IN LABOR FORCE | AGE 16-19
0.4/ 100
METRIC RATING
273rd/ 347
METRIC RANK
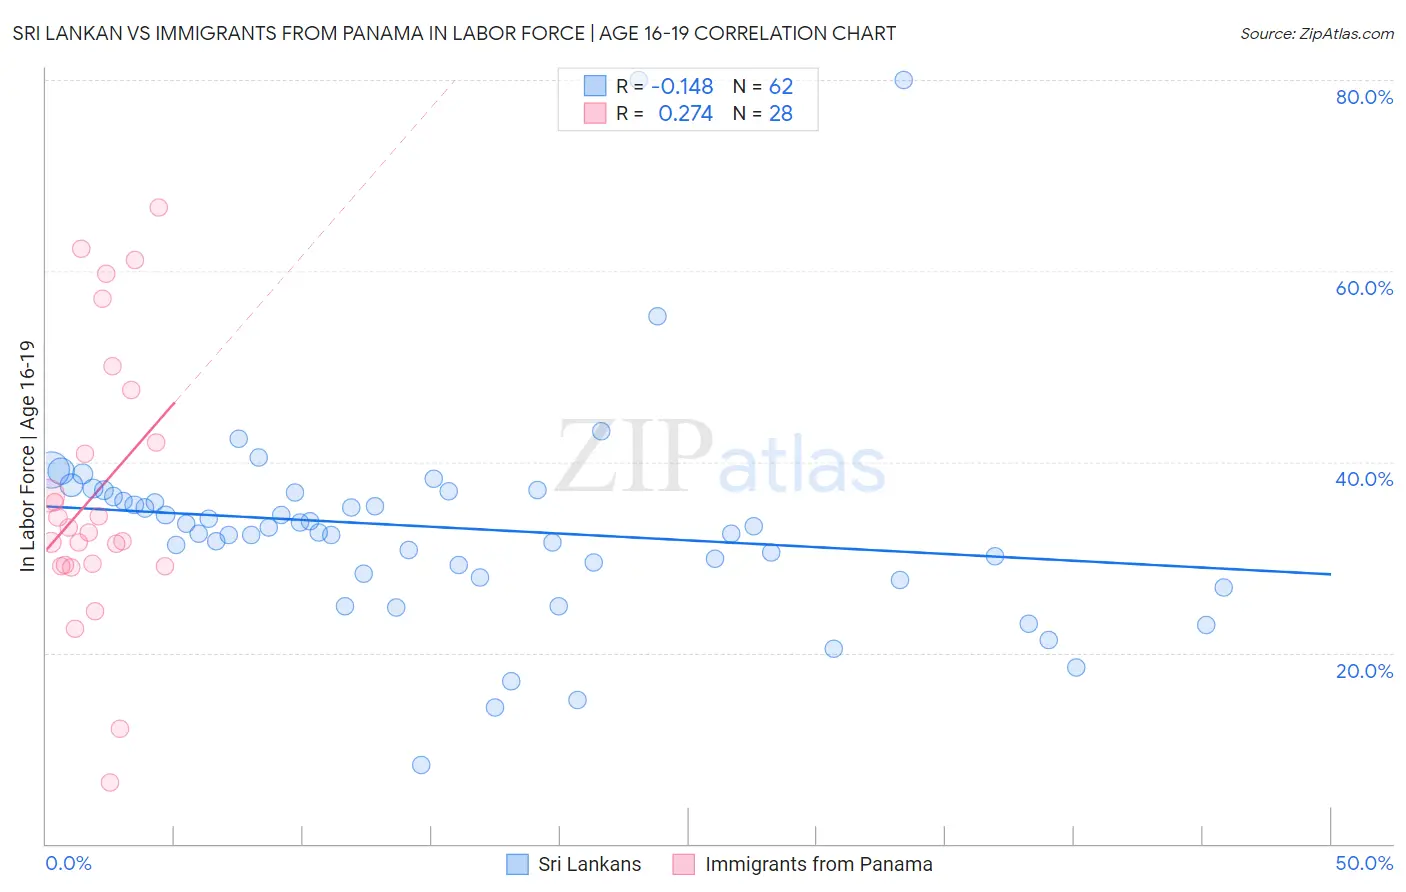
Sri Lankan vs Immigrants from Panama In Labor Force | Age 16-19 Correlation Chart
The statistical analysis conducted on geographies consisting of 440,040,037 people shows a poor negative correlation between the proportion of Sri Lankans and labor force participation rate among population between the ages 16 and 19 in the United States with a correlation coefficient (R) of -0.148 and weighted average of 35.5%. Similarly, the statistical analysis conducted on geographies consisting of 221,074,600 people shows a weak positive correlation between the proportion of Immigrants from Panama and labor force participation rate among population between the ages 16 and 19 in the United States with a correlation coefficient (R) of 0.274 and weighted average of 34.0%, a difference of 4.6%.
In Labor Force | Age 16-19 Correlation Summary
| Measurement | Sri Lankan | Immigrants from Panama |
| Minimum | 8.2% | 6.4% |
| Maximum | 80.0% | 66.7% |
| Range | 71.8% | 60.3% |
| Mean | 33.1% | 36.8% |
| Median | 32.9% | 32.8% |
| Interquartile 25% (IQ1) | 28.3% | 29.2% |
| Interquartile 75% (IQ3) | 36.8% | 44.8% |
| Interquartile Range (IQR) | 8.5% | 15.6% |
| Standard Deviation (Sample) | 11.5% | 14.6% |
| Standard Deviation (Population) | 11.4% | 14.3% |
Similar Demographics by In Labor Force | Age 16-19
Demographics Similar to Sri Lankans by In Labor Force | Age 16-19
In terms of in labor force | age 16-19, the demographic groups most similar to Sri Lankans are Dutch West Indian (35.6%, a difference of 0.12%), Immigrants from Costa Rica (35.6%, a difference of 0.12%), Immigrants from South Eastern Asia (35.6%, a difference of 0.14%), Apache (35.6%, a difference of 0.16%), and Houma (35.6%, a difference of 0.17%).
| Demographics | Rating | Rank | In Labor Force | Age 16-19 |
| Mexicans | 11.9 /100 | #211 | Poor 35.6% |
| Houma | 11.0 /100 | #212 | Poor 35.6% |
| Immigrants | Bolivia | 11.0 /100 | #213 | Poor 35.6% |
| Apache | 11.0 /100 | #214 | Poor 35.6% |
| Immigrants | South Eastern Asia | 10.8 /100 | #215 | Poor 35.6% |
| Dutch West Indians | 10.7 /100 | #216 | Poor 35.6% |
| Immigrants | Costa Rica | 10.7 /100 | #217 | Poor 35.6% |
| Sri Lankans | 9.8 /100 | #218 | Tragic 35.5% |
| Guatemalans | 8.6 /100 | #219 | Tragic 35.5% |
| Immigrants | Bahamas | 8.3 /100 | #220 | Tragic 35.5% |
| Turks | 7.3 /100 | #221 | Tragic 35.4% |
| Immigrants | Ghana | 7.3 /100 | #222 | Tragic 35.4% |
| Ghanaians | 6.5 /100 | #223 | Tragic 35.3% |
| Hondurans | 6.5 /100 | #224 | Tragic 35.3% |
| Immigrants | Belgium | 6.1 /100 | #225 | Tragic 35.3% |
Demographics Similar to Immigrants from Panama by In Labor Force | Age 16-19
In terms of in labor force | age 16-19, the demographic groups most similar to Immigrants from Panama are Venezuelan (34.0%, a difference of 0.090%), Immigrants from Fiji (33.9%, a difference of 0.18%), Asian (34.1%, a difference of 0.22%), Immigrants from Russia (34.1%, a difference of 0.24%), and Central American Indian (34.1%, a difference of 0.24%).
| Demographics | Rating | Rank | In Labor Force | Age 16-19 |
| Immigrants | Malaysia | 0.7 /100 | #266 | Tragic 34.3% |
| Immigrants | Peru | 0.5 /100 | #267 | Tragic 34.2% |
| Immigrants | Asia | 0.5 /100 | #268 | Tragic 34.1% |
| Pima | 0.5 /100 | #269 | Tragic 34.1% |
| Immigrants | Russia | 0.4 /100 | #270 | Tragic 34.1% |
| Central American Indians | 0.4 /100 | #271 | Tragic 34.1% |
| Asians | 0.4 /100 | #272 | Tragic 34.1% |
| Immigrants | Panama | 0.4 /100 | #273 | Tragic 34.0% |
| Venezuelans | 0.3 /100 | #274 | Tragic 34.0% |
| Immigrants | Fiji | 0.3 /100 | #275 | Tragic 33.9% |
| Immigrants | Latin America | 0.3 /100 | #276 | Tragic 33.9% |
| Menominee | 0.3 /100 | #277 | Tragic 33.9% |
| Colombians | 0.3 /100 | #278 | Tragic 33.8% |
| Paraguayans | 0.3 /100 | #279 | Tragic 33.8% |
| Taiwanese | 0.3 /100 | #280 | Tragic 33.8% |