Spanish vs Immigrants from Middle Africa In Labor Force | Age 30-34
COMPARE
Spanish
Immigrants from Middle Africa
In Labor Force | Age 30-34
In Labor Force | Age 30-34 Comparison
Spanish
Immigrants from Middle Africa
83.5%
IN LABOR FORCE | AGE 30-34
0.0/ 100
METRIC RATING
271st/ 347
METRIC RANK
85.2%
IN LABOR FORCE | AGE 30-34
96.3/ 100
METRIC RATING
106th/ 347
METRIC RANK
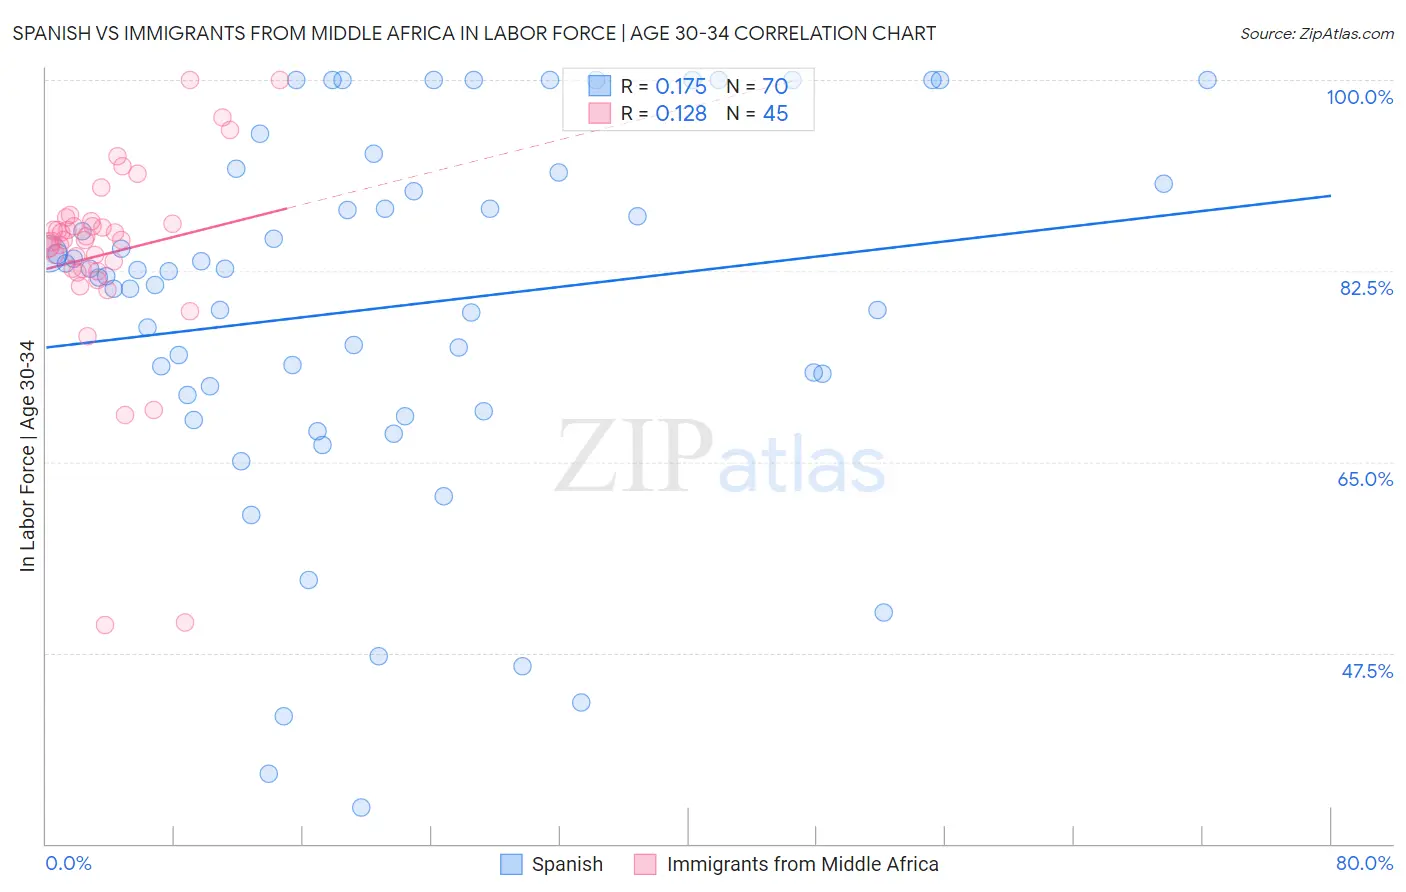
Spanish vs Immigrants from Middle Africa In Labor Force | Age 30-34 Correlation Chart
The statistical analysis conducted on geographies consisting of 421,842,107 people shows a poor positive correlation between the proportion of Spanish and labor force participation rate among population between the ages 30 and 34 in the United States with a correlation coefficient (R) of 0.175 and weighted average of 83.5%. Similarly, the statistical analysis conducted on geographies consisting of 202,689,912 people shows a poor positive correlation between the proportion of Immigrants from Middle Africa and labor force participation rate among population between the ages 30 and 34 in the United States with a correlation coefficient (R) of 0.128 and weighted average of 85.2%, a difference of 2.0%.
In Labor Force | Age 30-34 Correlation Summary
| Measurement | Spanish | Immigrants from Middle Africa |
| Minimum | 33.3% | 50.0% |
| Maximum | 100.0% | 100.0% |
| Range | 66.7% | 50.0% |
| Mean | 79.2% | 84.1% |
| Median | 82.2% | 85.3% |
| Interquartile 25% (IQ1) | 71.1% | 82.6% |
| Interquartile 75% (IQ3) | 90.5% | 86.9% |
| Interquartile Range (IQR) | 19.4% | 4.3% |
| Standard Deviation (Sample) | 16.7% | 9.5% |
| Standard Deviation (Population) | 16.6% | 9.4% |
Similar Demographics by In Labor Force | Age 30-34
Demographics Similar to Spanish by In Labor Force | Age 30-34
In terms of in labor force | age 30-34, the demographic groups most similar to Spanish are Nonimmigrants (83.5%, a difference of 0.0%), Spanish American (83.5%, a difference of 0.020%), Guamanian/Chamorro (83.5%, a difference of 0.050%), Belizean (83.5%, a difference of 0.060%), and Vietnamese (83.6%, a difference of 0.070%).
| Demographics | Rating | Rank | In Labor Force | Age 30-34 |
| Guatemalans | 0.2 /100 | #264 | Tragic 83.7% |
| Immigrants | Honduras | 0.1 /100 | #265 | Tragic 83.7% |
| Immigrants | Guatemala | 0.1 /100 | #266 | Tragic 83.7% |
| Spaniards | 0.1 /100 | #267 | Tragic 83.6% |
| Immigrants | Bangladesh | 0.1 /100 | #268 | Tragic 83.6% |
| Vietnamese | 0.1 /100 | #269 | Tragic 83.6% |
| Spanish Americans | 0.0 /100 | #270 | Tragic 83.5% |
| Spanish | 0.0 /100 | #271 | Tragic 83.5% |
| Immigrants | Nonimmigrants | 0.0 /100 | #272 | Tragic 83.5% |
| Guamanians/Chamorros | 0.0 /100 | #273 | Tragic 83.5% |
| Belizeans | 0.0 /100 | #274 | Tragic 83.5% |
| Immigrants | Grenada | 0.0 /100 | #275 | Tragic 83.5% |
| Tongans | 0.0 /100 | #276 | Tragic 83.5% |
| Delaware | 0.0 /100 | #277 | Tragic 83.5% |
| Fijians | 0.0 /100 | #278 | Tragic 83.4% |
Demographics Similar to Immigrants from Middle Africa by In Labor Force | Age 30-34
In terms of in labor force | age 30-34, the demographic groups most similar to Immigrants from Middle Africa are Alsatian (85.2%, a difference of 0.0%), Immigrants from Northern Africa (85.2%, a difference of 0.0%), Ukrainian (85.2%, a difference of 0.010%), Immigrants from Ghana (85.2%, a difference of 0.010%), and Immigrants from Austria (85.2%, a difference of 0.020%).
| Demographics | Rating | Rank | In Labor Force | Age 30-34 |
| Belgians | 97.2 /100 | #99 | Exceptional 85.2% |
| Sudanese | 97.1 /100 | #100 | Exceptional 85.2% |
| Immigrants | Belarus | 96.9 /100 | #101 | Exceptional 85.2% |
| Immigrants | Austria | 96.8 /100 | #102 | Exceptional 85.2% |
| Ukrainians | 96.6 /100 | #103 | Exceptional 85.2% |
| Immigrants | Ghana | 96.5 /100 | #104 | Exceptional 85.2% |
| Alsatians | 96.3 /100 | #105 | Exceptional 85.2% |
| Immigrants | Middle Africa | 96.3 /100 | #106 | Exceptional 85.2% |
| Immigrants | Northern Africa | 96.3 /100 | #107 | Exceptional 85.2% |
| Immigrants | Zimbabwe | 95.8 /100 | #108 | Exceptional 85.1% |
| Argentineans | 95.8 /100 | #109 | Exceptional 85.1% |
| Immigrants | South Africa | 95.3 /100 | #110 | Exceptional 85.1% |
| Immigrants | Scotland | 94.9 /100 | #111 | Exceptional 85.1% |
| Immigrants | Hungary | 94.8 /100 | #112 | Exceptional 85.1% |
| Immigrants | Romania | 94.7 /100 | #113 | Exceptional 85.1% |