Immigrants from Switzerland vs Immigrants from Middle Africa In Labor Force | Age 30-34
COMPARE
Immigrants from Switzerland
Immigrants from Middle Africa
In Labor Force | Age 30-34
In Labor Force | Age 30-34 Comparison
Immigrants from Switzerland
Immigrants from Middle Africa
85.3%
IN LABOR FORCE | AGE 30-34
98.7/ 100
METRIC RATING
79th/ 347
METRIC RANK
85.2%
IN LABOR FORCE | AGE 30-34
96.3/ 100
METRIC RATING
106th/ 347
METRIC RANK
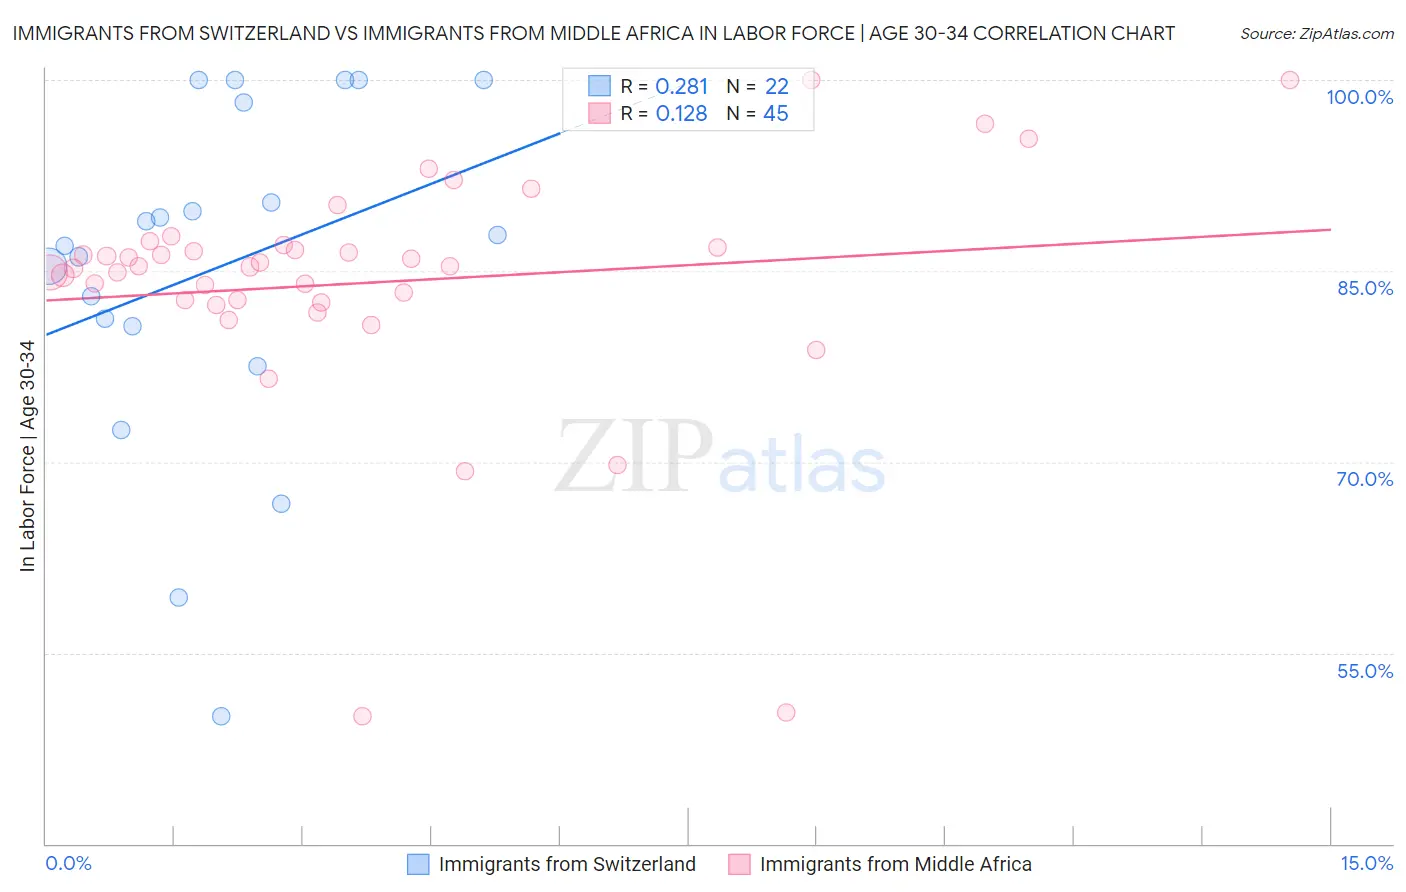
Immigrants from Switzerland vs Immigrants from Middle Africa In Labor Force | Age 30-34 Correlation Chart
The statistical analysis conducted on geographies consisting of 148,037,951 people shows a weak positive correlation between the proportion of Immigrants from Switzerland and labor force participation rate among population between the ages 30 and 34 in the United States with a correlation coefficient (R) of 0.281 and weighted average of 85.3%. Similarly, the statistical analysis conducted on geographies consisting of 202,689,912 people shows a poor positive correlation between the proportion of Immigrants from Middle Africa and labor force participation rate among population between the ages 30 and 34 in the United States with a correlation coefficient (R) of 0.128 and weighted average of 85.2%, a difference of 0.19%.
In Labor Force | Age 30-34 Correlation Summary
| Measurement | Immigrants from Switzerland | Immigrants from Middle Africa |
| Minimum | 50.0% | 50.0% |
| Maximum | 100.0% | 100.0% |
| Range | 50.0% | 50.0% |
| Mean | 85.2% | 84.1% |
| Median | 87.4% | 85.3% |
| Interquartile 25% (IQ1) | 80.6% | 82.6% |
| Interquartile 75% (IQ3) | 98.2% | 86.9% |
| Interquartile Range (IQR) | 17.6% | 4.3% |
| Standard Deviation (Sample) | 13.6% | 9.5% |
| Standard Deviation (Population) | 13.2% | 9.4% |
Similar Demographics by In Labor Force | Age 30-34
Demographics Similar to Immigrants from Switzerland by In Labor Force | Age 30-34
In terms of in labor force | age 30-34, the demographic groups most similar to Immigrants from Switzerland are Immigrants from Russia (85.3%, a difference of 0.0%), Immigrants from Singapore (85.3%, a difference of 0.010%), Slovak (85.3%, a difference of 0.010%), Immigrants from Africa (85.3%, a difference of 0.010%), and Immigrants from Europe (85.3%, a difference of 0.020%).
| Demographics | Rating | Rank | In Labor Force | Age 30-34 |
| Immigrants | China | 99.0 /100 | #72 | Exceptional 85.4% |
| Indians (Asian) | 99.0 /100 | #73 | Exceptional 85.4% |
| Maltese | 99.0 /100 | #74 | Exceptional 85.4% |
| Immigrants | Czechoslovakia | 99.0 /100 | #75 | Exceptional 85.4% |
| Iranians | 99.0 /100 | #76 | Exceptional 85.4% |
| Immigrants | Eastern Asia | 98.9 /100 | #77 | Exceptional 85.4% |
| Immigrants | Singapore | 98.8 /100 | #78 | Exceptional 85.3% |
| Immigrants | Switzerland | 98.7 /100 | #79 | Exceptional 85.3% |
| Immigrants | Russia | 98.7 /100 | #80 | Exceptional 85.3% |
| Slovaks | 98.7 /100 | #81 | Exceptional 85.3% |
| Immigrants | Africa | 98.6 /100 | #82 | Exceptional 85.3% |
| Immigrants | Europe | 98.6 /100 | #83 | Exceptional 85.3% |
| Greeks | 98.6 /100 | #84 | Exceptional 85.3% |
| Mongolians | 98.5 /100 | #85 | Exceptional 85.3% |
| Immigrants | Taiwan | 98.3 /100 | #86 | Exceptional 85.3% |
Demographics Similar to Immigrants from Middle Africa by In Labor Force | Age 30-34
In terms of in labor force | age 30-34, the demographic groups most similar to Immigrants from Middle Africa are Alsatian (85.2%, a difference of 0.0%), Immigrants from Northern Africa (85.2%, a difference of 0.0%), Ukrainian (85.2%, a difference of 0.010%), Immigrants from Ghana (85.2%, a difference of 0.010%), and Immigrants from Austria (85.2%, a difference of 0.020%).
| Demographics | Rating | Rank | In Labor Force | Age 30-34 |
| Belgians | 97.2 /100 | #99 | Exceptional 85.2% |
| Sudanese | 97.1 /100 | #100 | Exceptional 85.2% |
| Immigrants | Belarus | 96.9 /100 | #101 | Exceptional 85.2% |
| Immigrants | Austria | 96.8 /100 | #102 | Exceptional 85.2% |
| Ukrainians | 96.6 /100 | #103 | Exceptional 85.2% |
| Immigrants | Ghana | 96.5 /100 | #104 | Exceptional 85.2% |
| Alsatians | 96.3 /100 | #105 | Exceptional 85.2% |
| Immigrants | Middle Africa | 96.3 /100 | #106 | Exceptional 85.2% |
| Immigrants | Northern Africa | 96.3 /100 | #107 | Exceptional 85.2% |
| Immigrants | Zimbabwe | 95.8 /100 | #108 | Exceptional 85.1% |
| Argentineans | 95.8 /100 | #109 | Exceptional 85.1% |
| Immigrants | South Africa | 95.3 /100 | #110 | Exceptional 85.1% |
| Immigrants | Scotland | 94.9 /100 | #111 | Exceptional 85.1% |
| Immigrants | Hungary | 94.8 /100 | #112 | Exceptional 85.1% |
| Immigrants | Romania | 94.7 /100 | #113 | Exceptional 85.1% |