Slavic vs Immigrants from Middle Africa In Labor Force | Age 30-34
COMPARE
Slavic
Immigrants from Middle Africa
In Labor Force | Age 30-34
In Labor Force | Age 30-34 Comparison
Slavs
Immigrants from Middle Africa
85.0%
IN LABOR FORCE | AGE 30-34
90.7/ 100
METRIC RATING
127th/ 347
METRIC RANK
85.2%
IN LABOR FORCE | AGE 30-34
96.3/ 100
METRIC RATING
106th/ 347
METRIC RANK
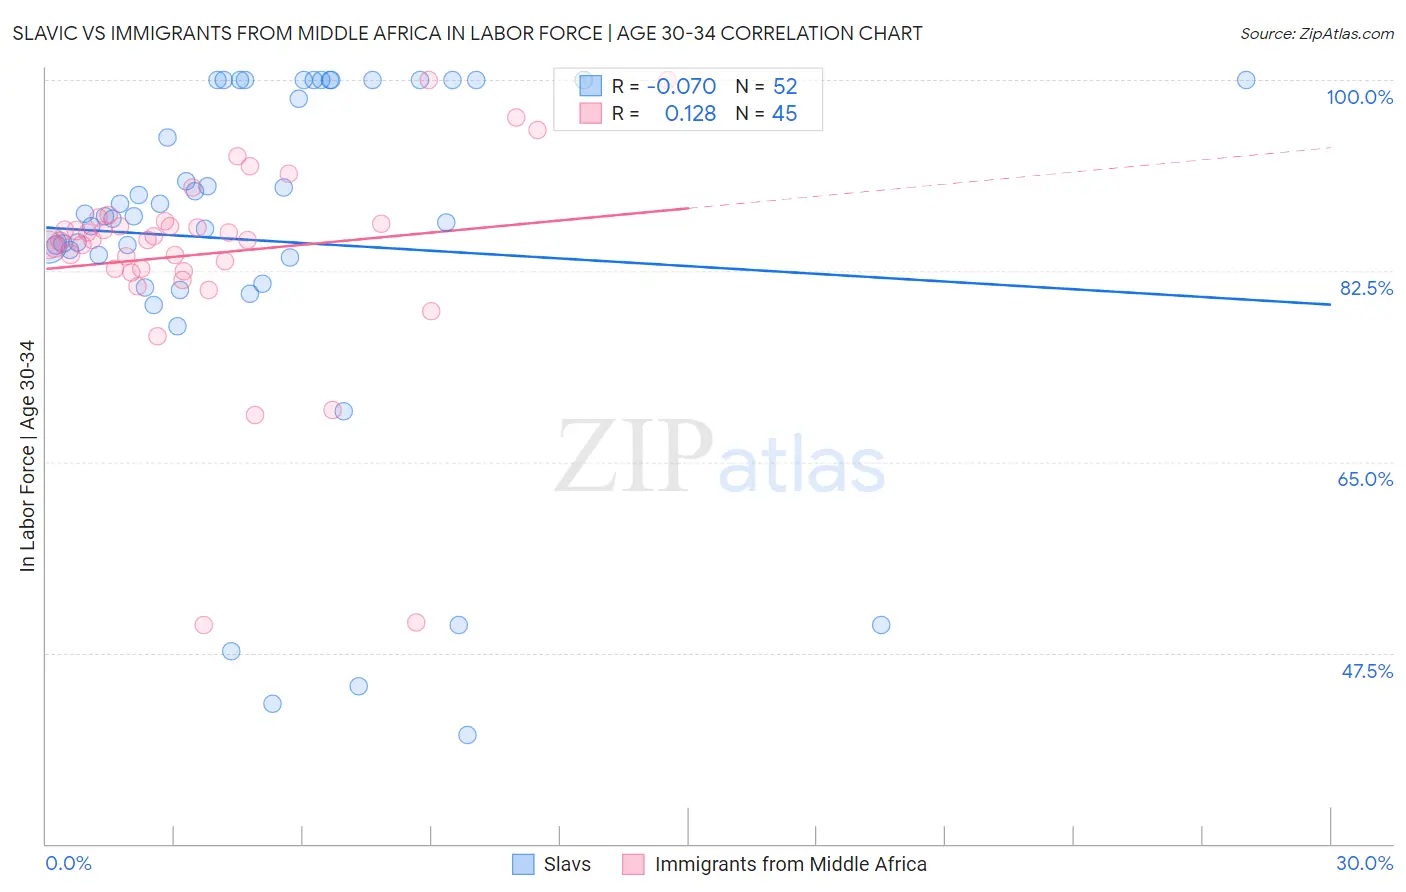
Slavic vs Immigrants from Middle Africa In Labor Force | Age 30-34 Correlation Chart
The statistical analysis conducted on geographies consisting of 270,763,521 people shows a slight negative correlation between the proportion of Slavs and labor force participation rate among population between the ages 30 and 34 in the United States with a correlation coefficient (R) of -0.070 and weighted average of 85.0%. Similarly, the statistical analysis conducted on geographies consisting of 202,689,912 people shows a poor positive correlation between the proportion of Immigrants from Middle Africa and labor force participation rate among population between the ages 30 and 34 in the United States with a correlation coefficient (R) of 0.128 and weighted average of 85.2%, a difference of 0.17%.
In Labor Force | Age 30-34 Correlation Summary
| Measurement | Slavic | Immigrants from Middle Africa |
| Minimum | 40.0% | 50.0% |
| Maximum | 100.0% | 100.0% |
| Range | 60.0% | 50.0% |
| Mean | 85.2% | 84.1% |
| Median | 87.5% | 85.3% |
| Interquartile 25% (IQ1) | 82.5% | 82.6% |
| Interquartile 75% (IQ3) | 100.0% | 86.9% |
| Interquartile Range (IQR) | 17.5% | 4.3% |
| Standard Deviation (Sample) | 16.3% | 9.5% |
| Standard Deviation (Population) | 16.1% | 9.4% |
Similar Demographics by In Labor Force | Age 30-34
Demographics Similar to Slavs by In Labor Force | Age 30-34
In terms of in labor force | age 30-34, the demographic groups most similar to Slavs are Austrian (85.0%, a difference of 0.0%), Immigrants from Argentina (85.0%, a difference of 0.0%), Immigrants from Western Africa (85.0%, a difference of 0.010%), Immigrants from Spain (85.0%, a difference of 0.010%), and Immigrants from Jordan (85.0%, a difference of 0.020%).
| Demographics | Rating | Rank | In Labor Force | Age 30-34 |
| Immigrants | Southern Europe | 93.3 /100 | #120 | Exceptional 85.1% |
| Immigrants | Egypt | 93.2 /100 | #121 | Exceptional 85.1% |
| Immigrants | Kuwait | 92.6 /100 | #122 | Exceptional 85.1% |
| Armenians | 92.2 /100 | #123 | Exceptional 85.0% |
| Australians | 92.0 /100 | #124 | Exceptional 85.0% |
| Immigrants | Jordan | 91.5 /100 | #125 | Exceptional 85.0% |
| Austrians | 90.9 /100 | #126 | Exceptional 85.0% |
| Slavs | 90.7 /100 | #127 | Exceptional 85.0% |
| Immigrants | Argentina | 90.6 /100 | #128 | Exceptional 85.0% |
| Immigrants | Western Africa | 90.2 /100 | #129 | Exceptional 85.0% |
| Immigrants | Spain | 90.0 /100 | #130 | Exceptional 85.0% |
| Chinese | 89.6 /100 | #131 | Excellent 85.0% |
| Immigrants | Israel | 89.5 /100 | #132 | Excellent 85.0% |
| New Zealanders | 89.5 /100 | #133 | Excellent 85.0% |
| Immigrants | Chile | 89.2 /100 | #134 | Excellent 85.0% |
Demographics Similar to Immigrants from Middle Africa by In Labor Force | Age 30-34
In terms of in labor force | age 30-34, the demographic groups most similar to Immigrants from Middle Africa are Alsatian (85.2%, a difference of 0.0%), Immigrants from Northern Africa (85.2%, a difference of 0.0%), Ukrainian (85.2%, a difference of 0.010%), Immigrants from Ghana (85.2%, a difference of 0.010%), and Immigrants from Austria (85.2%, a difference of 0.020%).
| Demographics | Rating | Rank | In Labor Force | Age 30-34 |
| Belgians | 97.2 /100 | #99 | Exceptional 85.2% |
| Sudanese | 97.1 /100 | #100 | Exceptional 85.2% |
| Immigrants | Belarus | 96.9 /100 | #101 | Exceptional 85.2% |
| Immigrants | Austria | 96.8 /100 | #102 | Exceptional 85.2% |
| Ukrainians | 96.6 /100 | #103 | Exceptional 85.2% |
| Immigrants | Ghana | 96.5 /100 | #104 | Exceptional 85.2% |
| Alsatians | 96.3 /100 | #105 | Exceptional 85.2% |
| Immigrants | Middle Africa | 96.3 /100 | #106 | Exceptional 85.2% |
| Immigrants | Northern Africa | 96.3 /100 | #107 | Exceptional 85.2% |
| Immigrants | Zimbabwe | 95.8 /100 | #108 | Exceptional 85.1% |
| Argentineans | 95.8 /100 | #109 | Exceptional 85.1% |
| Immigrants | South Africa | 95.3 /100 | #110 | Exceptional 85.1% |
| Immigrants | Scotland | 94.9 /100 | #111 | Exceptional 85.1% |
| Immigrants | Hungary | 94.8 /100 | #112 | Exceptional 85.1% |
| Immigrants | Romania | 94.7 /100 | #113 | Exceptional 85.1% |