Immigrants from Serbia vs Immigrants from Middle Africa In Labor Force | Age 30-34
COMPARE
Immigrants from Serbia
Immigrants from Middle Africa
In Labor Force | Age 30-34
In Labor Force | Age 30-34 Comparison
Immigrants from Serbia
Immigrants from Middle Africa
86.2%
IN LABOR FORCE | AGE 30-34
100.0/ 100
METRIC RATING
10th/ 347
METRIC RANK
85.2%
IN LABOR FORCE | AGE 30-34
96.3/ 100
METRIC RATING
106th/ 347
METRIC RANK
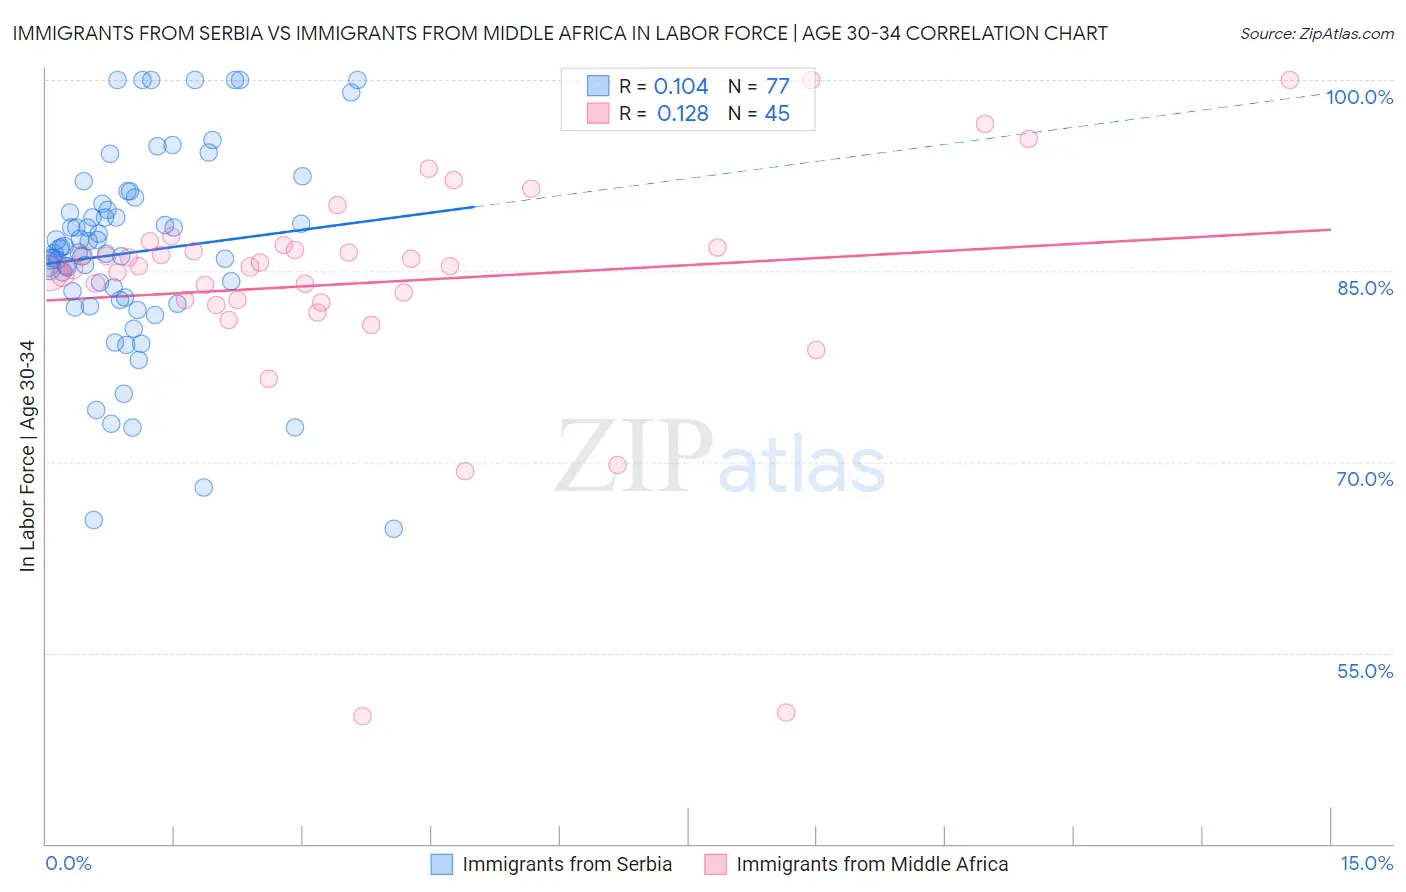
Immigrants from Serbia vs Immigrants from Middle Africa In Labor Force | Age 30-34 Correlation Chart
The statistical analysis conducted on geographies consisting of 131,692,327 people shows a poor positive correlation between the proportion of Immigrants from Serbia and labor force participation rate among population between the ages 30 and 34 in the United States with a correlation coefficient (R) of 0.104 and weighted average of 86.2%. Similarly, the statistical analysis conducted on geographies consisting of 202,689,912 people shows a poor positive correlation between the proportion of Immigrants from Middle Africa and labor force participation rate among population between the ages 30 and 34 in the United States with a correlation coefficient (R) of 0.128 and weighted average of 85.2%, a difference of 1.2%.
In Labor Force | Age 30-34 Correlation Summary
| Measurement | Immigrants from Serbia | Immigrants from Middle Africa |
| Minimum | 64.7% | 50.0% |
| Maximum | 100.0% | 100.0% |
| Range | 35.3% | 50.0% |
| Mean | 86.5% | 84.1% |
| Median | 86.5% | 85.3% |
| Interquartile 25% (IQ1) | 82.8% | 82.6% |
| Interquartile 75% (IQ3) | 90.0% | 86.9% |
| Interquartile Range (IQR) | 7.2% | 4.3% |
| Standard Deviation (Sample) | 7.7% | 9.5% |
| Standard Deviation (Population) | 7.7% | 9.4% |
Similar Demographics by In Labor Force | Age 30-34
Demographics Similar to Immigrants from Serbia by In Labor Force | Age 30-34
In terms of in labor force | age 30-34, the demographic groups most similar to Immigrants from Serbia are Carpatho Rusyn (86.2%, a difference of 0.010%), Immigrants from Somalia (86.2%, a difference of 0.040%), Cambodian (86.2%, a difference of 0.050%), Immigrants from Bolivia (86.2%, a difference of 0.060%), and Somali (86.2%, a difference of 0.070%).
| Demographics | Rating | Rank | In Labor Force | Age 30-34 |
| Immigrants | Ethiopia | 100.0 /100 | #3 | Exceptional 86.6% |
| Liberians | 100.0 /100 | #4 | Exceptional 86.4% |
| Immigrants | Ireland | 100.0 /100 | #5 | Exceptional 86.3% |
| Somalis | 100.0 /100 | #6 | Exceptional 86.2% |
| Immigrants | Bolivia | 100.0 /100 | #7 | Exceptional 86.2% |
| Cambodians | 100.0 /100 | #8 | Exceptional 86.2% |
| Immigrants | Somalia | 100.0 /100 | #9 | Exceptional 86.2% |
| Immigrants | Serbia | 100.0 /100 | #10 | Exceptional 86.2% |
| Carpatho Rusyns | 100.0 /100 | #11 | Exceptional 86.2% |
| Bolivians | 100.0 /100 | #12 | Exceptional 86.1% |
| Immigrants | Croatia | 100.0 /100 | #13 | Exceptional 86.1% |
| Immigrants | Cabo Verde | 100.0 /100 | #14 | Exceptional 86.1% |
| Immigrants | Albania | 100.0 /100 | #15 | Exceptional 86.1% |
| Latvians | 100.0 /100 | #16 | Exceptional 86.0% |
| Immigrants | Cameroon | 100.0 /100 | #17 | Exceptional 86.0% |
Demographics Similar to Immigrants from Middle Africa by In Labor Force | Age 30-34
In terms of in labor force | age 30-34, the demographic groups most similar to Immigrants from Middle Africa are Alsatian (85.2%, a difference of 0.0%), Immigrants from Northern Africa (85.2%, a difference of 0.0%), Ukrainian (85.2%, a difference of 0.010%), Immigrants from Ghana (85.2%, a difference of 0.010%), and Immigrants from Austria (85.2%, a difference of 0.020%).
| Demographics | Rating | Rank | In Labor Force | Age 30-34 |
| Belgians | 97.2 /100 | #99 | Exceptional 85.2% |
| Sudanese | 97.1 /100 | #100 | Exceptional 85.2% |
| Immigrants | Belarus | 96.9 /100 | #101 | Exceptional 85.2% |
| Immigrants | Austria | 96.8 /100 | #102 | Exceptional 85.2% |
| Ukrainians | 96.6 /100 | #103 | Exceptional 85.2% |
| Immigrants | Ghana | 96.5 /100 | #104 | Exceptional 85.2% |
| Alsatians | 96.3 /100 | #105 | Exceptional 85.2% |
| Immigrants | Middle Africa | 96.3 /100 | #106 | Exceptional 85.2% |
| Immigrants | Northern Africa | 96.3 /100 | #107 | Exceptional 85.2% |
| Immigrants | Zimbabwe | 95.8 /100 | #108 | Exceptional 85.1% |
| Argentineans | 95.8 /100 | #109 | Exceptional 85.1% |
| Immigrants | South Africa | 95.3 /100 | #110 | Exceptional 85.1% |
| Immigrants | Scotland | 94.9 /100 | #111 | Exceptional 85.1% |
| Immigrants | Hungary | 94.8 /100 | #112 | Exceptional 85.1% |
| Immigrants | Romania | 94.7 /100 | #113 | Exceptional 85.1% |