Spanish vs Immigrants from Middle Africa Unemployment Among Ages 45 to 54 years
COMPARE
Spanish
Immigrants from Middle Africa
Unemployment Among Ages 45 to 54 years
Unemployment Among Ages 45 to 54 years Comparison
Spanish
Immigrants from Middle Africa
4.4%
UNEMPLOYMENT AMONG AGES 45 TO 54 YEARS
88.8/ 100
METRIC RATING
124th/ 347
METRIC RANK
4.4%
UNEMPLOYMENT AMONG AGES 45 TO 54 YEARS
83.3/ 100
METRIC RATING
136th/ 347
METRIC RANK
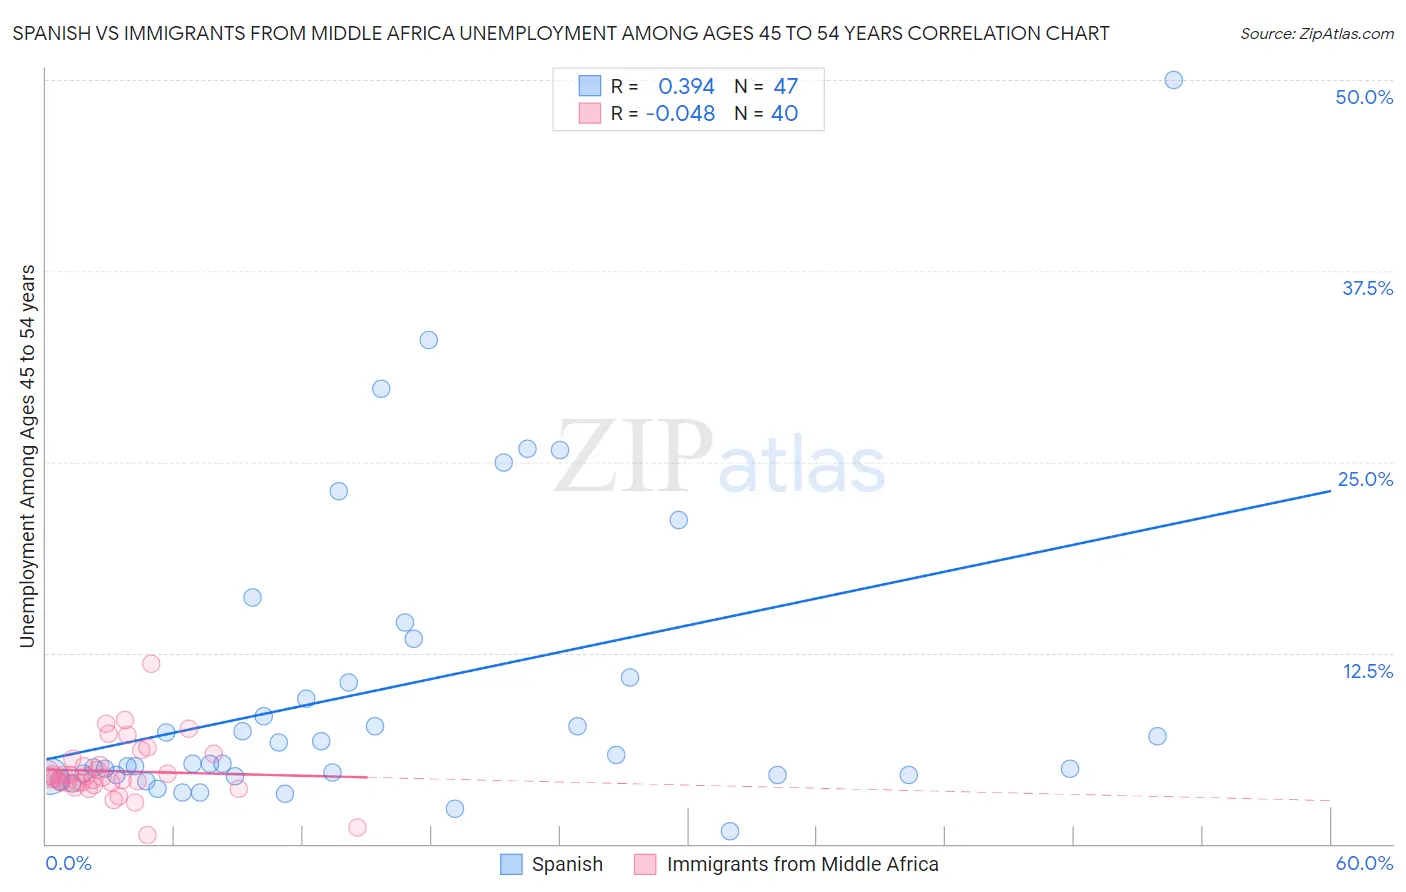
Spanish vs Immigrants from Middle Africa Unemployment Among Ages 45 to 54 years Correlation Chart
The statistical analysis conducted on geographies consisting of 409,284,519 people shows a mild positive correlation between the proportion of Spanish and unemployment rate among population between the ages 45 and 54 in the United States with a correlation coefficient (R) of 0.394 and weighted average of 4.4%. Similarly, the statistical analysis conducted on geographies consisting of 200,641,916 people shows no correlation between the proportion of Immigrants from Middle Africa and unemployment rate among population between the ages 45 and 54 in the United States with a correlation coefficient (R) of -0.048 and weighted average of 4.4%, a difference of 0.55%.
Unemployment Among Ages 45 to 54 years Correlation Summary
| Measurement | Spanish | Immigrants from Middle Africa |
| Minimum | 0.80% | 0.60% |
| Maximum | 50.0% | 11.8% |
| Range | 49.2% | 11.2% |
| Mean | 10.1% | 4.8% |
| Median | 5.3% | 4.3% |
| Interquartile 25% (IQ1) | 4.5% | 4.0% |
| Interquartile 75% (IQ3) | 10.9% | 5.3% |
| Interquartile Range (IQR) | 6.4% | 1.4% |
| Standard Deviation (Sample) | 9.9% | 1.9% |
| Standard Deviation (Population) | 9.8% | 1.9% |
Demographics Similar to Spanish and Immigrants from Middle Africa by Unemployment Among Ages 45 to 54 years
In terms of unemployment among ages 45 to 54 years, the demographic groups most similar to Spanish are Immigrants from Asia (4.4%, a difference of 0.0%), Immigrants from Vietnam (4.4%, a difference of 0.020%), Immigrants from Kazakhstan (4.4%, a difference of 0.090%), American (4.4%, a difference of 0.10%), and Immigrants from Oceania (4.4%, a difference of 0.10%). Similarly, the demographic groups most similar to Immigrants from Middle Africa are Immigrants from Eastern Asia (4.4%, a difference of 0.060%), Afghan (4.4%, a difference of 0.11%), Lebanese (4.4%, a difference of 0.12%), Immigrants from Cameroon (4.4%, a difference of 0.13%), and Immigrants from Congo (4.4%, a difference of 0.13%).
| Demographics | Rating | Rank | Unemployment Among Ages 45 to 54 years |
| Americans | 89.6 /100 | #120 | Excellent 4.4% |
| Immigrants | Oceania | 89.5 /100 | #121 | Excellent 4.4% |
| Immigrants | Kazakhstan | 89.5 /100 | #122 | Excellent 4.4% |
| Immigrants | Asia | 88.8 /100 | #123 | Excellent 4.4% |
| Spanish | 88.8 /100 | #124 | Excellent 4.4% |
| Immigrants | Vietnam | 88.6 /100 | #125 | Excellent 4.4% |
| Immigrants | Czechoslovakia | 87.8 /100 | #126 | Excellent 4.4% |
| Nicaraguans | 87.6 /100 | #127 | Excellent 4.4% |
| Immigrants | Northern Europe | 86.9 /100 | #128 | Excellent 4.4% |
| Laotians | 86.3 /100 | #129 | Excellent 4.4% |
| Celtics | 86.2 /100 | #130 | Excellent 4.4% |
| Immigrants | Germany | 85.9 /100 | #131 | Excellent 4.4% |
| Immigrants | Eastern Africa | 85.1 /100 | #132 | Excellent 4.4% |
| Immigrants | Cameroon | 84.8 /100 | #133 | Excellent 4.4% |
| Afghans | 84.6 /100 | #134 | Excellent 4.4% |
| Immigrants | Eastern Asia | 84.0 /100 | #135 | Excellent 4.4% |
| Immigrants | Middle Africa | 83.3 /100 | #136 | Excellent 4.4% |
| Lebanese | 81.9 /100 | #137 | Excellent 4.4% |
| Immigrants | Congo | 81.8 /100 | #138 | Excellent 4.4% |
| Immigrants | Kuwait | 81.7 /100 | #139 | Excellent 4.4% |
| Immigrants | Zaire | 80.7 /100 | #140 | Excellent 4.4% |