Spanish vs Soviet Union In Labor Force | Age 30-34
COMPARE
Spanish
Soviet Union
In Labor Force | Age 30-34
In Labor Force | Age 30-34 Comparison
Spanish
Soviet Union
83.5%
IN LABOR FORCE | AGE 30-34
0.0/ 100
METRIC RATING
271st/ 347
METRIC RANK
85.5%
IN LABOR FORCE | AGE 30-34
99.4/ 100
METRIC RATING
62nd/ 347
METRIC RANK
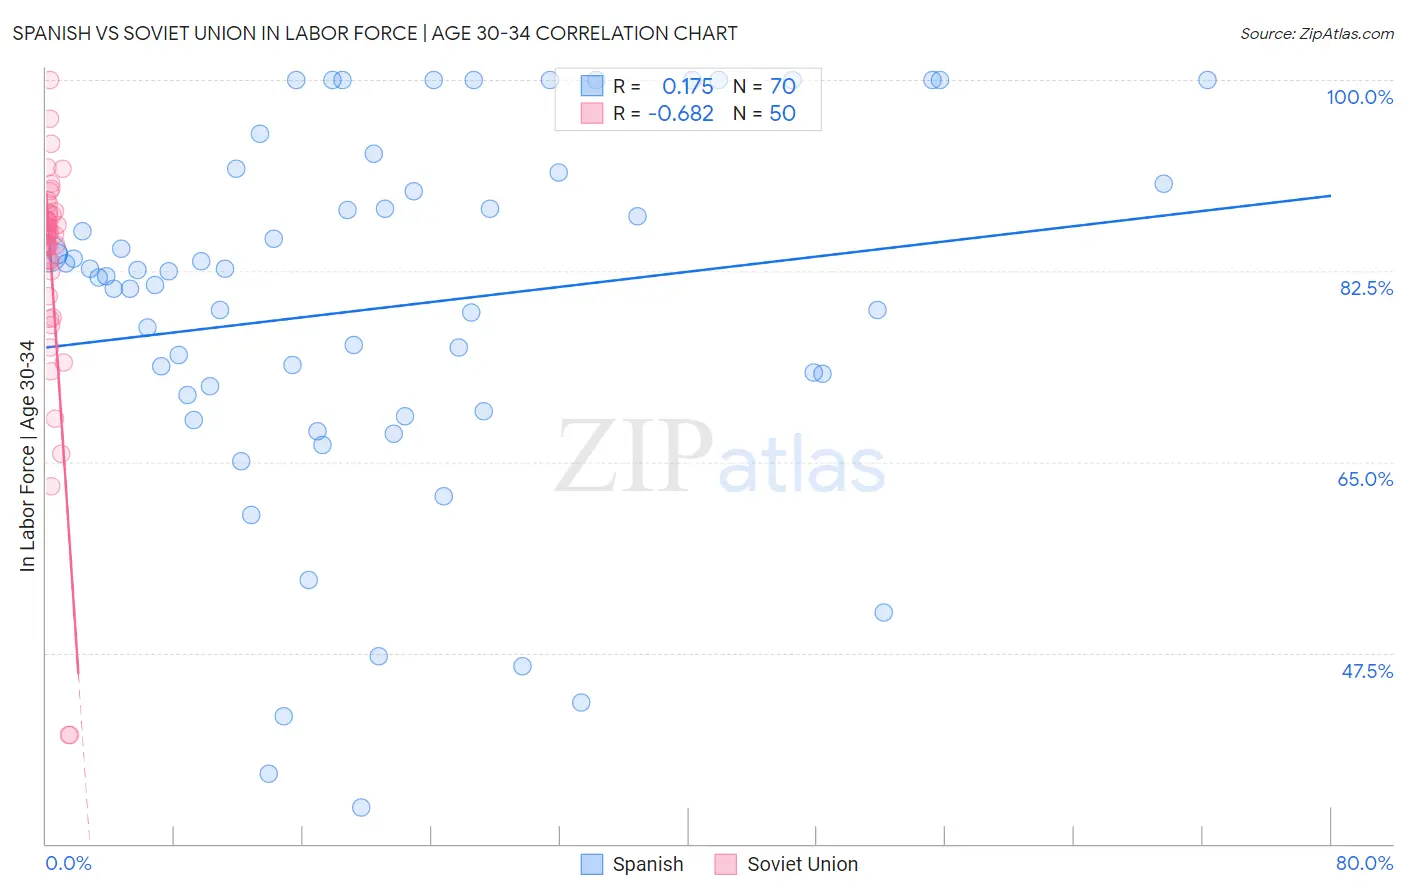
Spanish vs Soviet Union In Labor Force | Age 30-34 Correlation Chart
The statistical analysis conducted on geographies consisting of 421,842,107 people shows a poor positive correlation between the proportion of Spanish and labor force participation rate among population between the ages 30 and 34 in the United States with a correlation coefficient (R) of 0.175 and weighted average of 83.5%. Similarly, the statistical analysis conducted on geographies consisting of 43,512,203 people shows a significant negative correlation between the proportion of Soviet Union and labor force participation rate among population between the ages 30 and 34 in the United States with a correlation coefficient (R) of -0.682 and weighted average of 85.5%, a difference of 2.3%.
In Labor Force | Age 30-34 Correlation Summary
| Measurement | Spanish | Soviet Union |
| Minimum | 33.3% | 40.0% |
| Maximum | 100.0% | 100.0% |
| Range | 66.7% | 60.0% |
| Mean | 79.2% | 82.8% |
| Median | 82.2% | 85.9% |
| Interquartile 25% (IQ1) | 71.1% | 82.5% |
| Interquartile 75% (IQ3) | 90.5% | 87.8% |
| Interquartile Range (IQR) | 19.4% | 5.3% |
| Standard Deviation (Sample) | 16.7% | 11.2% |
| Standard Deviation (Population) | 16.6% | 11.1% |
Similar Demographics by In Labor Force | Age 30-34
Demographics Similar to Spanish by In Labor Force | Age 30-34
In terms of in labor force | age 30-34, the demographic groups most similar to Spanish are Nonimmigrants (83.5%, a difference of 0.0%), Spanish American (83.5%, a difference of 0.020%), Guamanian/Chamorro (83.5%, a difference of 0.050%), Belizean (83.5%, a difference of 0.060%), and Vietnamese (83.6%, a difference of 0.070%).
| Demographics | Rating | Rank | In Labor Force | Age 30-34 |
| Guatemalans | 0.2 /100 | #264 | Tragic 83.7% |
| Immigrants | Honduras | 0.1 /100 | #265 | Tragic 83.7% |
| Immigrants | Guatemala | 0.1 /100 | #266 | Tragic 83.7% |
| Spaniards | 0.1 /100 | #267 | Tragic 83.6% |
| Immigrants | Bangladesh | 0.1 /100 | #268 | Tragic 83.6% |
| Vietnamese | 0.1 /100 | #269 | Tragic 83.6% |
| Spanish Americans | 0.0 /100 | #270 | Tragic 83.5% |
| Spanish | 0.0 /100 | #271 | Tragic 83.5% |
| Immigrants | Nonimmigrants | 0.0 /100 | #272 | Tragic 83.5% |
| Guamanians/Chamorros | 0.0 /100 | #273 | Tragic 83.5% |
| Belizeans | 0.0 /100 | #274 | Tragic 83.5% |
| Immigrants | Grenada | 0.0 /100 | #275 | Tragic 83.5% |
| Tongans | 0.0 /100 | #276 | Tragic 83.5% |
| Delaware | 0.0 /100 | #277 | Tragic 83.5% |
| Fijians | 0.0 /100 | #278 | Tragic 83.4% |
Demographics Similar to Soviet Union by In Labor Force | Age 30-34
In terms of in labor force | age 30-34, the demographic groups most similar to Soviet Union are Macedonian (85.5%, a difference of 0.0%), Immigrants from France (85.5%, a difference of 0.010%), Immigrants from Brazil (85.5%, a difference of 0.010%), Italian (85.4%, a difference of 0.010%), and Senegalese (85.4%, a difference of 0.020%).
| Demographics | Rating | Rank | In Labor Force | Age 30-34 |
| Immigrants | Turkey | 99.6 /100 | #55 | Exceptional 85.5% |
| Czechs | 99.6 /100 | #56 | Exceptional 85.5% |
| Russians | 99.6 /100 | #57 | Exceptional 85.5% |
| Poles | 99.6 /100 | #58 | Exceptional 85.5% |
| Immigrants | Poland | 99.5 /100 | #59 | Exceptional 85.5% |
| Immigrants | France | 99.5 /100 | #60 | Exceptional 85.5% |
| Immigrants | Brazil | 99.5 /100 | #61 | Exceptional 85.5% |
| Soviet Union | 99.4 /100 | #62 | Exceptional 85.5% |
| Macedonians | 99.4 /100 | #63 | Exceptional 85.5% |
| Italians | 99.4 /100 | #64 | Exceptional 85.4% |
| Senegalese | 99.4 /100 | #65 | Exceptional 85.4% |
| Ghanaians | 99.4 /100 | #66 | Exceptional 85.4% |
| Kenyans | 99.3 /100 | #67 | Exceptional 85.4% |
| Immigrants | Eastern Europe | 99.3 /100 | #68 | Exceptional 85.4% |
| Immigrants | Iran | 99.2 /100 | #69 | Exceptional 85.4% |